 One tree
 One life

The UK-based financial firm needs a business intelligence solution (Data Visualization Services) which will improve their learning management system (LMS). The project team wanted to collect information from multiple data points in order to enhance teaching program administration capabilities as well as student learning interactions.
 Power BI
 Google Analytics
 One Drive
 MySQL
MySQL


The client system faced difficulties in report generation across diverse parameters which prevented effective analysis of performance and trend data.

A single business intelligence solution did not exist that could merge data between Google Analytics and other sources.

The client required a solution to manage complex chart design and establish adaptable reports with extensive formatting capabilities.

Protecting sensitive learning data at the financial firm was a significant concern since the business needed to fulfill multiple data protection regulations (including GDPR).
The Agile methodology and Fixed Cost model allowed SPEC INDIA to create a roadmap and architecture design structure for the product development. This ensured a systematic and iterative approach to development.
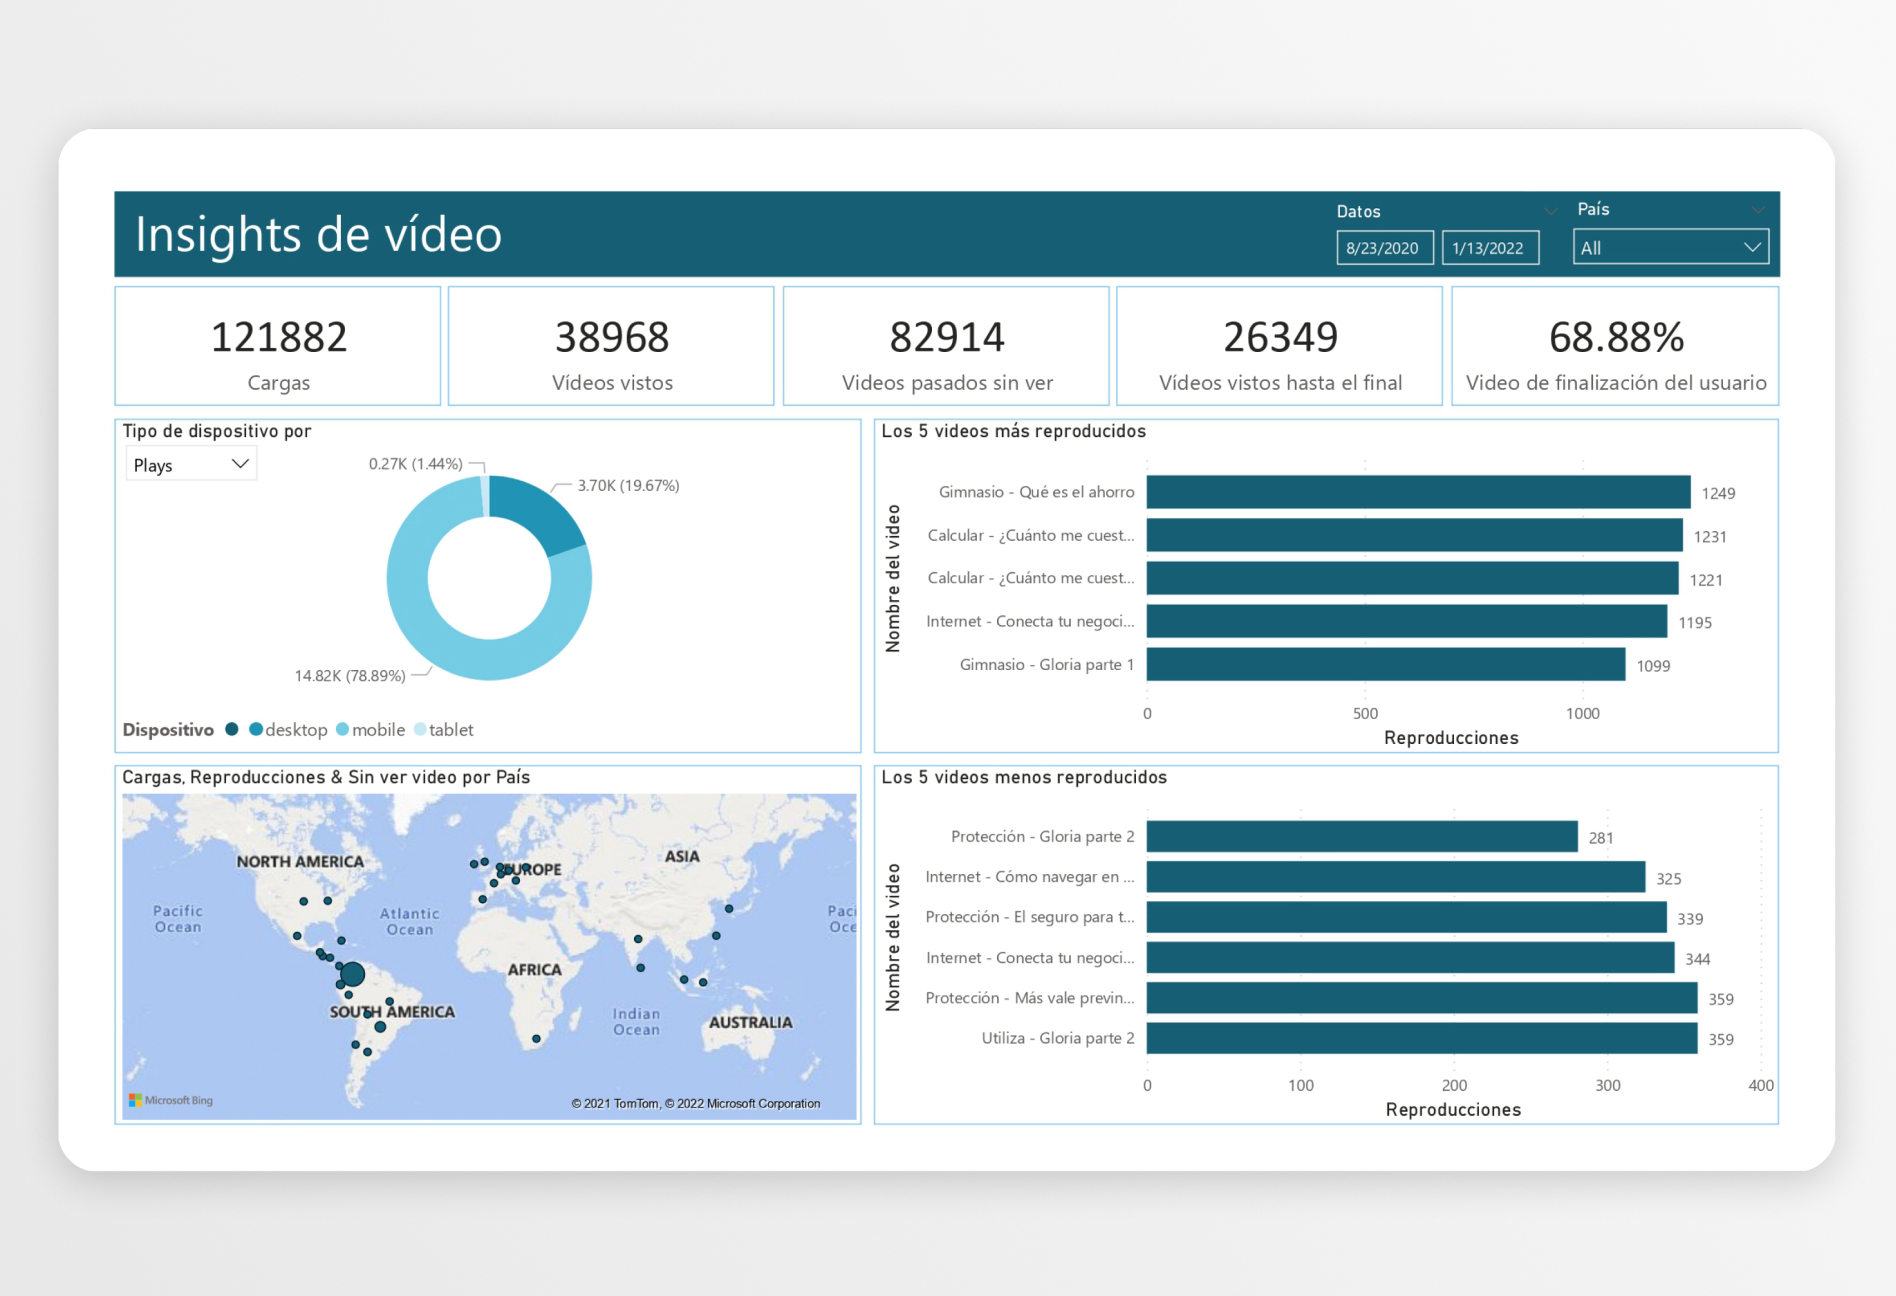
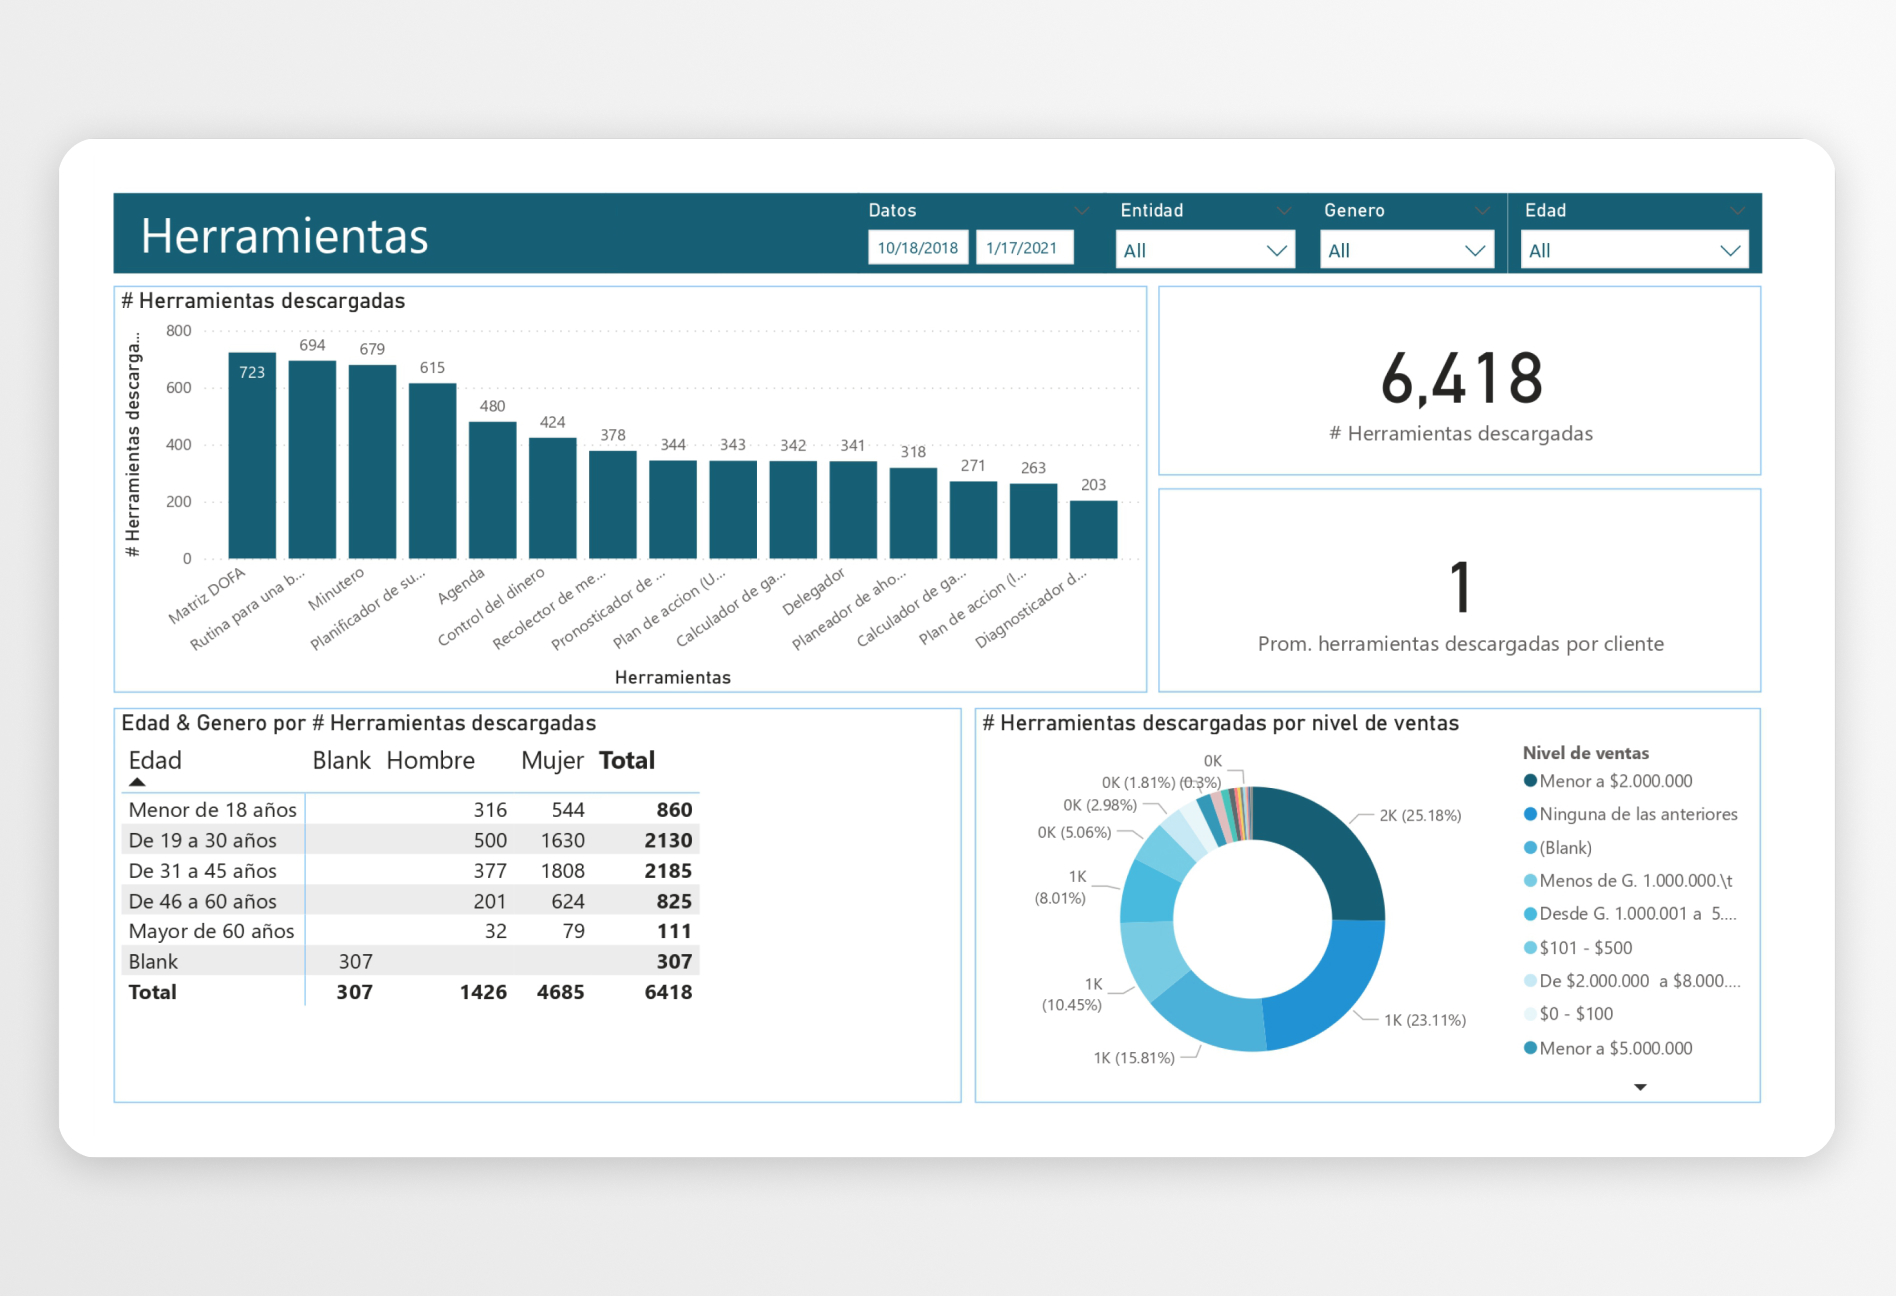
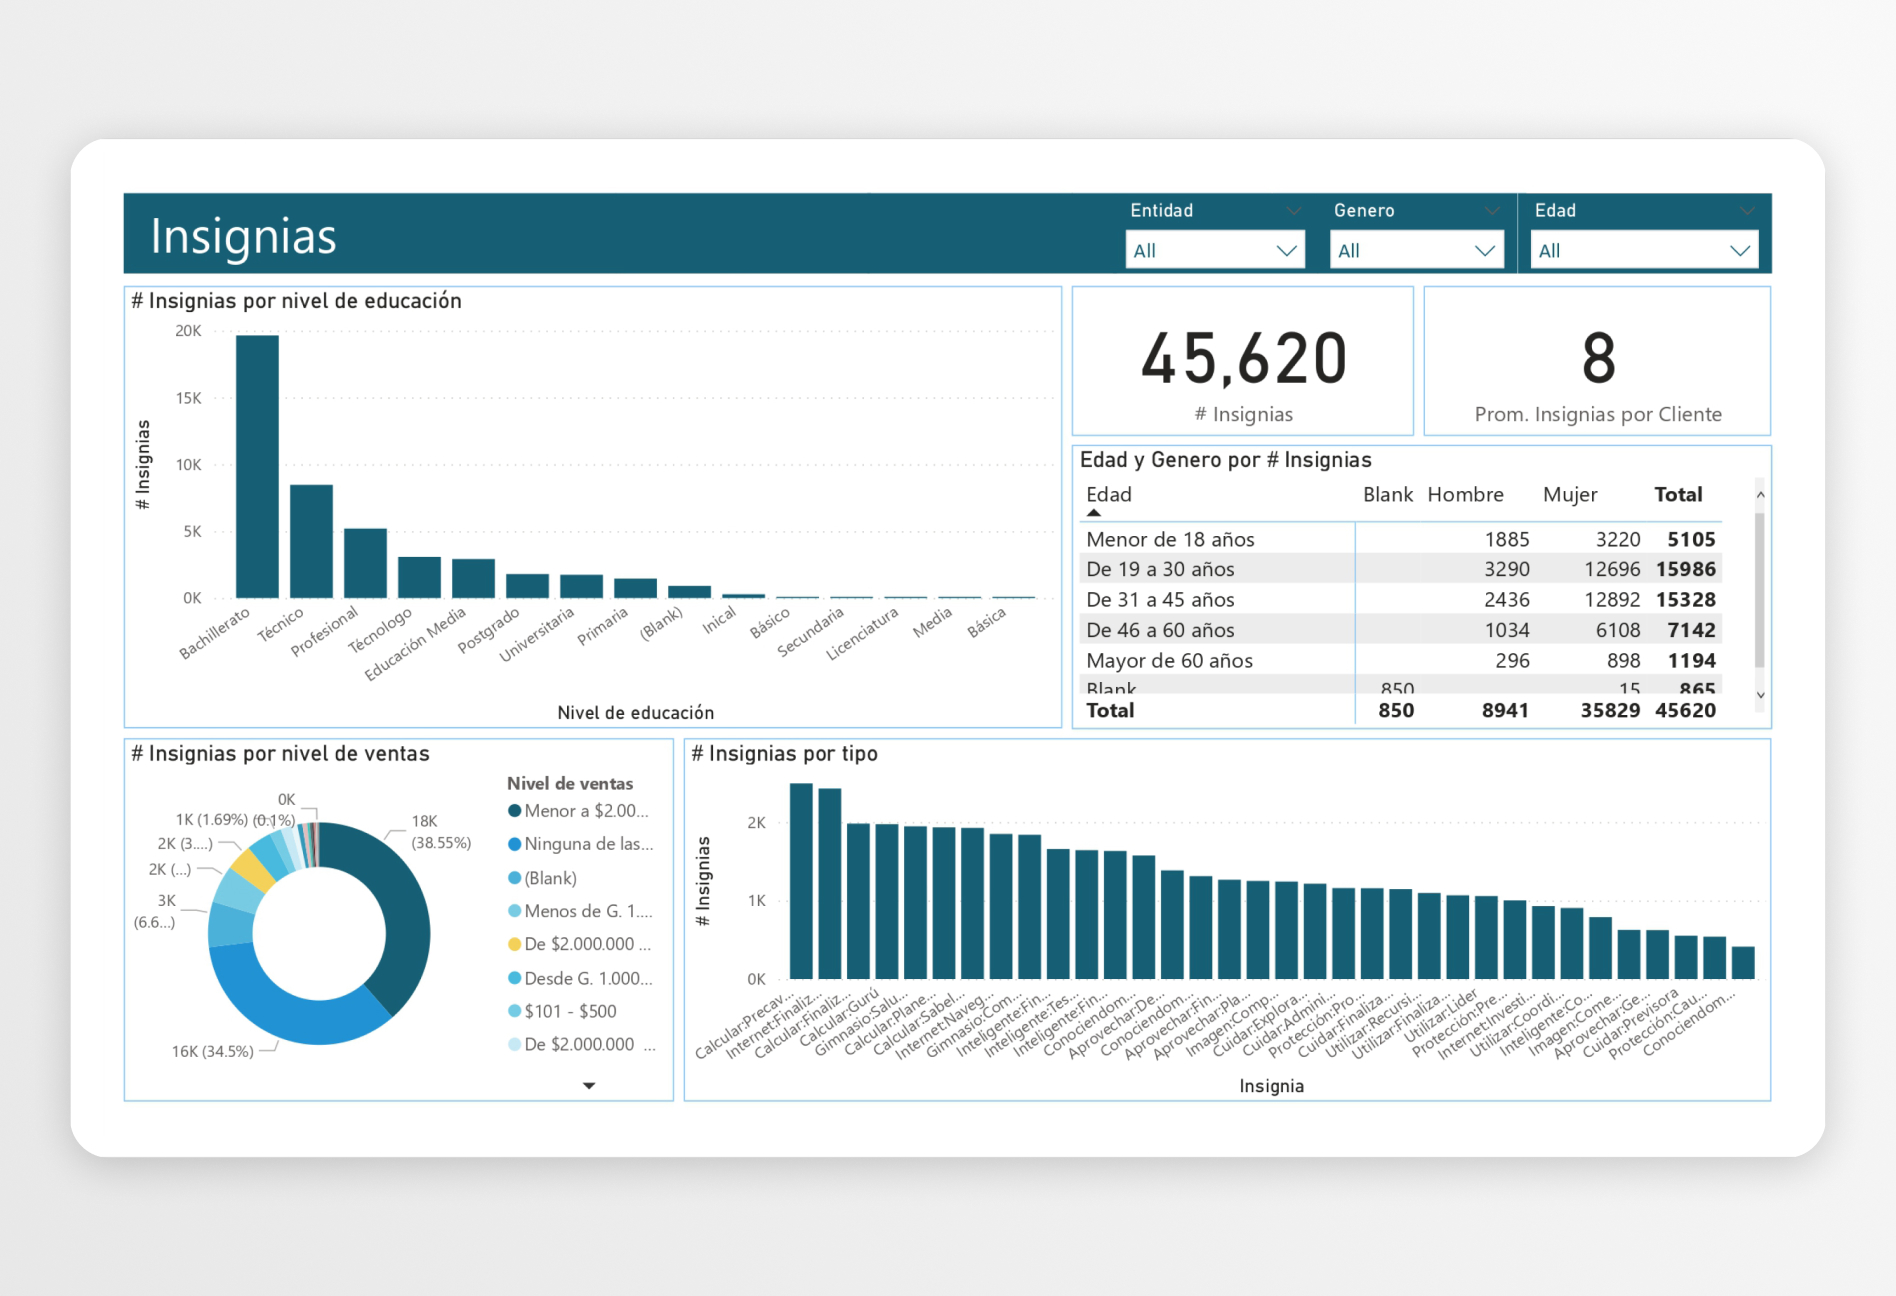
Our team conducted research into present-day methodologies to deploy Power BI dashboard solutions. The solution enabled the client to obtain interactive and detailed visual representations of their data through their interfaces.
Our technical solution consolidated data fields originating from Google Analytics, MySQL, OneDrive, and KACE system data into one unified business intelligence platform.


Our initial step involved assessing the client's difficulties, followed by a review of the client's data supply sources. The information allowed us to build a dependable solution plan.

We developed user-friendly dashboards through Power BI, which allowed users to view metrics and monitor learning activities effectively.

Our solution connected the KACE system and OneDrive to Google Analytics and MySQL platforms in order to generate one inclusive performance analytics dashboard.

After integrating multiple data sources, our team conducted thorough tests on the solution to validate its data reliability and operational stability alongside user-friendly design.

The client achieved operational success using this powerful business intelligence tool, which simplified LMS tracking functions and improved decision-making capabilities.

Our team developed business intelligence capabilities to make it easier for the client to monitor LMS operations and support request management while obtaining marketing performance metrics.
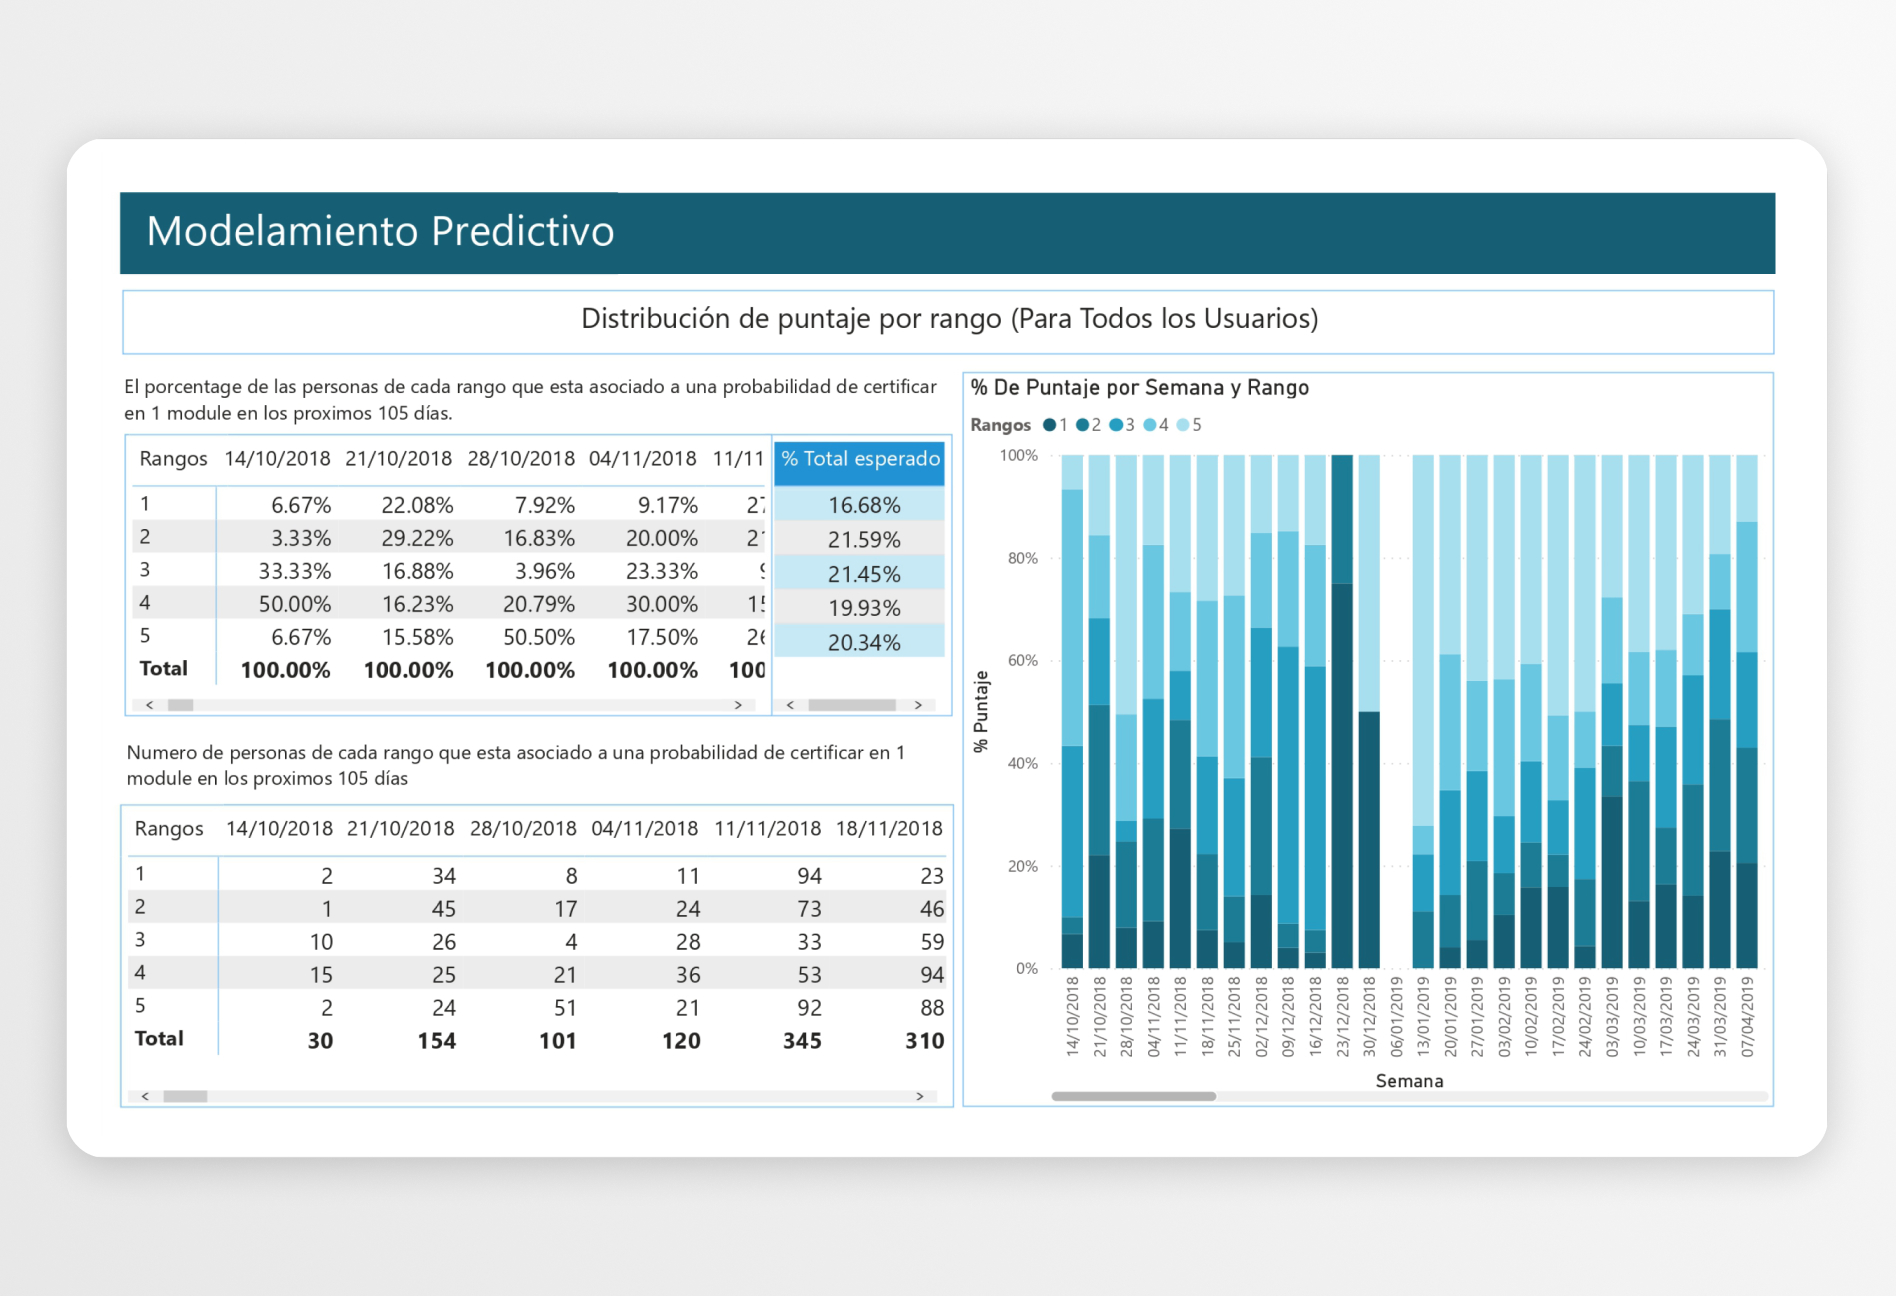
The solution developed a predictive capability to foresee course duration and user status, which helped the client gauge student advancement patterns.
Through interactive dashboards, users can engage better by viewing behavioral data that tracks their learning performance.
The analysis of product impact combined with strategic learning refinement enabled faster decision triggering.
Continuous monitoring of dashboards through data-driven insights helped establish better business expansion tactics which led to new jobs being created.

“SPEC House”, Parth Complex, Near Swastik Cross Roads, Navarangpura, Ahmedabad 380009, INDIA.
“SPEC Partner”, 350 Grove Street, Bridgewater, NJ 08807, United States.
This website uses cookies to ensure you get the best experience on our website. Learn more