 One tree
 One life

India
Power BI, Azure SQL Database, SQL Server
Finance and Employee Safety for Enterprise

They were keen to design and develop a business intelligence solution that can integrate seamlessly with their products and offer a great deal of flexibility to users, to see details of all calculations and metrics of margins, pricing in modular format and monitor performance with efficacy.
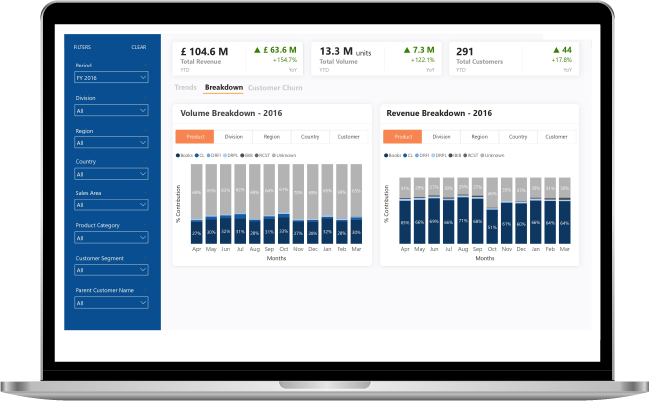
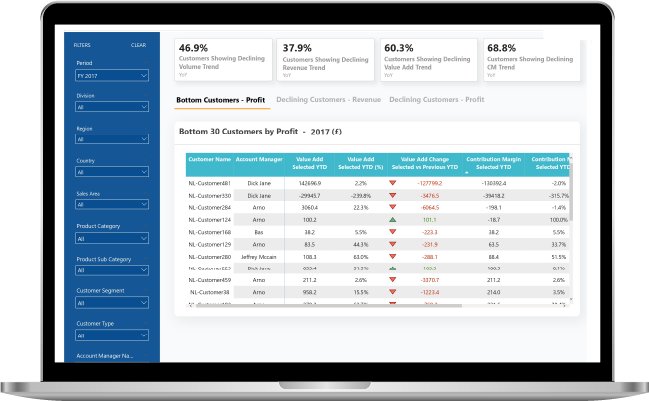
The client was finding it difficult to visualize different reports based on parameters. They were looking for a business intelligence application that could use complex features in Power BI, Customer Churn, and designs of column chart features. It was difficult for them to analyze the KPIs of sales data in terms of reports and dashboards.
Looking at the challenges faced by the client, SPEC INDIA followed the T & M model to develop the roadmap and architecture of the product. We designed and launched the Power BI reports and dashboards, after identifying and researching on various modern methodologies.
As a dedicated team-based model, we have offered a range of Power BI reports for activities in the manufacturing and finance industry. We have offered KPI-based reports that calculate Margins (Contribution, Gross), Net Profit, Pricings (Gross, Net, Discount) etc.
We have provided Customer Churn by using SQL + Measure solution and for the column chart, we made tweaks in the existing chart to make it look like a column chart as per requirement. It also includes reports that show top and bottom customers showing positive/declining volume/revenue/value add trends.
Growth Drivers: To track performance of volume and quantity wise analysis of sales with Customer Churn Analysis
Price Metrics: To track various pricing and margin from it like Net, Gross, Contribution etc.
Profit Analytics: Depicts overall picture of price with respect to profit after deduction of all the costs and various variance
Money Makers: To determine products and other entities which are generating positive sales for organization
Loss Makers: To determine products and other entities which are running in loss or having less margin
Sales Team Performance: To determine pricing details and margins by salesman to track performance
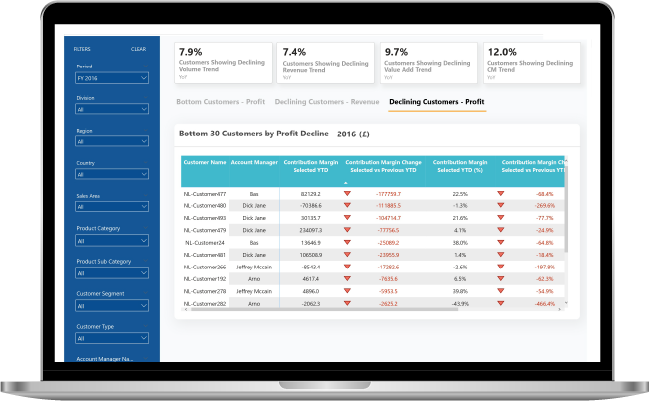
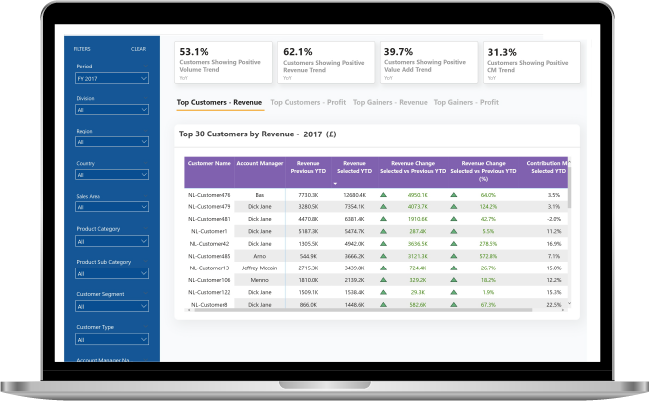
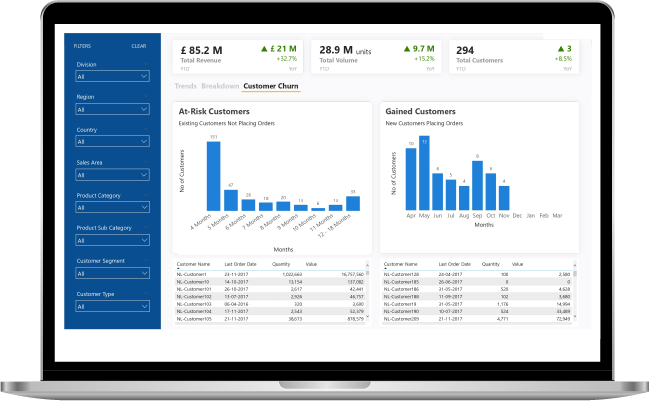

We have helped a number of global clientele with our analysis and reporting services to drive better performance based on data


Our detailed and accurate research, analysis, and refinement leads to a comprehensive study that describes the requirements, functions, and roles in a transparent manner.
We have a team of creative design experts who are apt at producing sleek designs of the system components with modernized layouts.
Our programmers are well versed with latest programming languages, tools, and techniques to effectively interpret the analysis and design into code.

Quality is at the helm of our projects. We leave no stone unturned in ensuring superior excellence and assurance in all our solutions and services.
We have well-defined, robust, and secure launch criteria that offer us a successful implementation clubbed with detailed testing, customer acceptance, and satisfaction.
Detailed view of products that need improvement in margins and sales to generate profit
Insights in an interactive manner
Faster decision making on product impact
Increased digitization inputs
Viewing dashboards on an ongoing basis
Futuristic view of business information
Dynamic representation and interaction with data
Business growth and job creation
“SPEC House”, Parth Complex, Near Swastik Cross Roads, Navarangpura, Ahmedabad 380009, INDIA.
“SPEC Partner”, 350 Grove Street, Bridgewater, NJ 08807, United States.
This website uses cookies to ensure you get the best experience on our website. Learn more