
The client is a well-known company that makes automotive and industrial lead-acid batteries and has been doing it for more than 60 years. As competition grew stronger, they wanted a smoother way to manage their daily operations and understand their data better so they could make faster and smarter decisions.

The client's goals were to streamline operations and gain valuable insights from their data to stay competitive in the market. They expected efficient solutions to optimize their processes and improve decision-making.
The existing system lacked streamlined access to both primary and secondary sales data, forcing users to manually compile the data in Excel sheets. This manual process led to inefficiencies and delays in data analysis and decision-making.
Users encountered difficulties when attempting to customize reports by adding or removing columns. This process was cumbersome and prone to errors, hindering their ability to tailor reports to specific needs or preferences efficiently.
The frequent alterations in data formats and scripts introduced complexities in data management, resulting in increased errors and inefficiencies. These changes disrupted the workflow and impeded smooth data processing and analysis.
Creating detailed reports with various parameters necessitated considerable time and effort from users. The complexity of generating such reports added to the workload and slowed down the overall reporting process, affecting productivity and decision-making timelines.
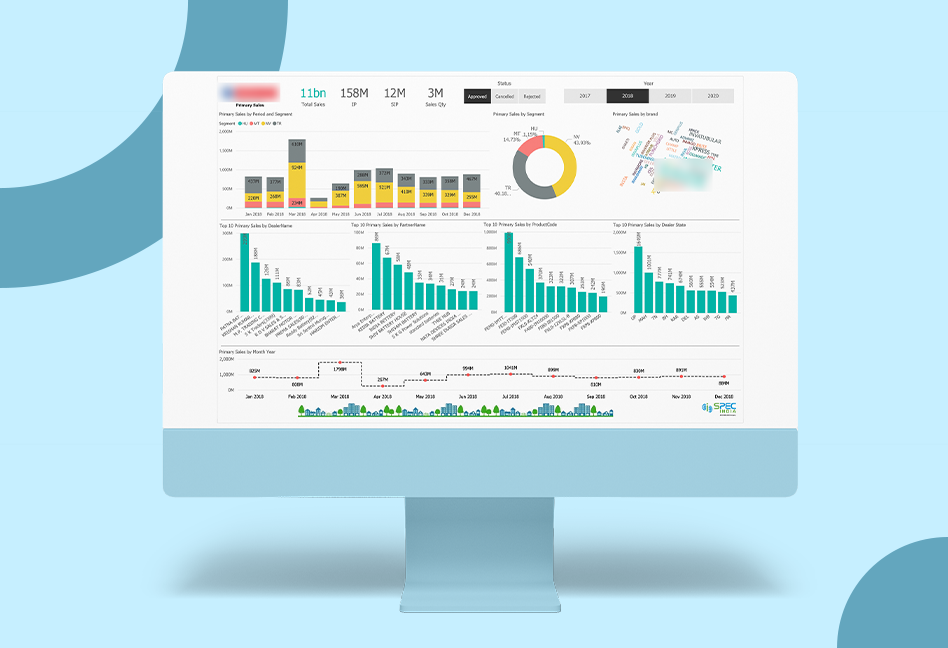
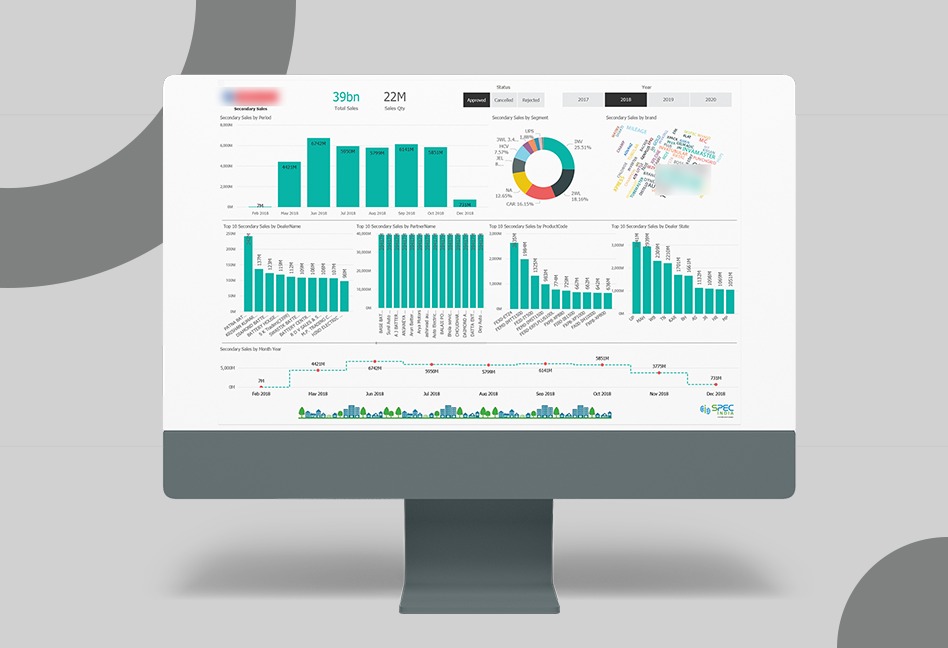
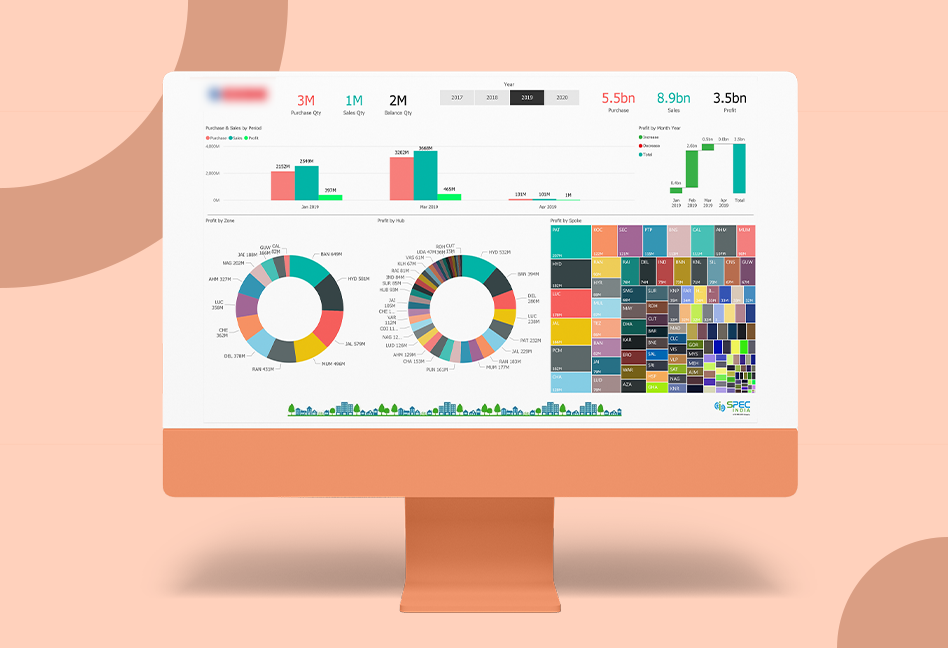
We created a single Power BI dashboard that brings all their data together in one place. This helped the client view key business information quickly without switching between multiple systems.
We combined all their separate reports into one organized reporting structure. This gave the client a complete and easy-to-understand view of their business performance.
We added interactive charts and visuals that allow users to explore data, drill down into details, and understand patterns more clearly.
We made report updates easier by allowing users to add or remove columns and make changes without depending on technical teams.
We enabled filters for time, region, product, and other key parameters so users can focus only on the information they need.
We ensured smooth integration with Excel, allowing the client to directly import Excel data into Power BI and turn it into meaningful insights.


Reports and dashboards can now be easily modified as per user requirements.
Direct access to reports saved significant time for business users. Accessing reports has become much easier as compared to previous methods.
The graphics interface enabled quick and efficient data analysis with minimal effort. Data analysis became a cup of tea for the client.
Integrated reports facilitated rapid downloading of massive data in Excel format. The time taken to download the data has significantly improved after the development of the Power BI Dashboard.

SPEC House, Parth Complex, Near Swastik Cross Roads, Navarangpura, Ahmedabad 380009, INDIA.
This website uses cookies to ensure you get the best experience on our website. Read Spec India’s Privacy Policy