Go Green One tree
One life
Trees
Loading...

Power BI Analytics Dashboard For Patient Management

The client is one of the largest healthcare organizations in the United States of America and operates several hospital centers. The organization wanted to have a Power BI Analytics Dashboard to manage their patients more effectively. They were looking to monitoring patient statistics, tracking treatment details, and ensuring an efficient delivery of personalized healthcare services across all its units.

  • Industry
    Healthcare
  • Country
    USA
Technologies
Power BI Analytics Dashboard For Patient Management
Years In Business
36+
Years In Business
Projects Delivered
3000+
Projects Delivered
Happy Clients
200+
Happy Clients
Countries Served
40+
Countries Served

Business Goals

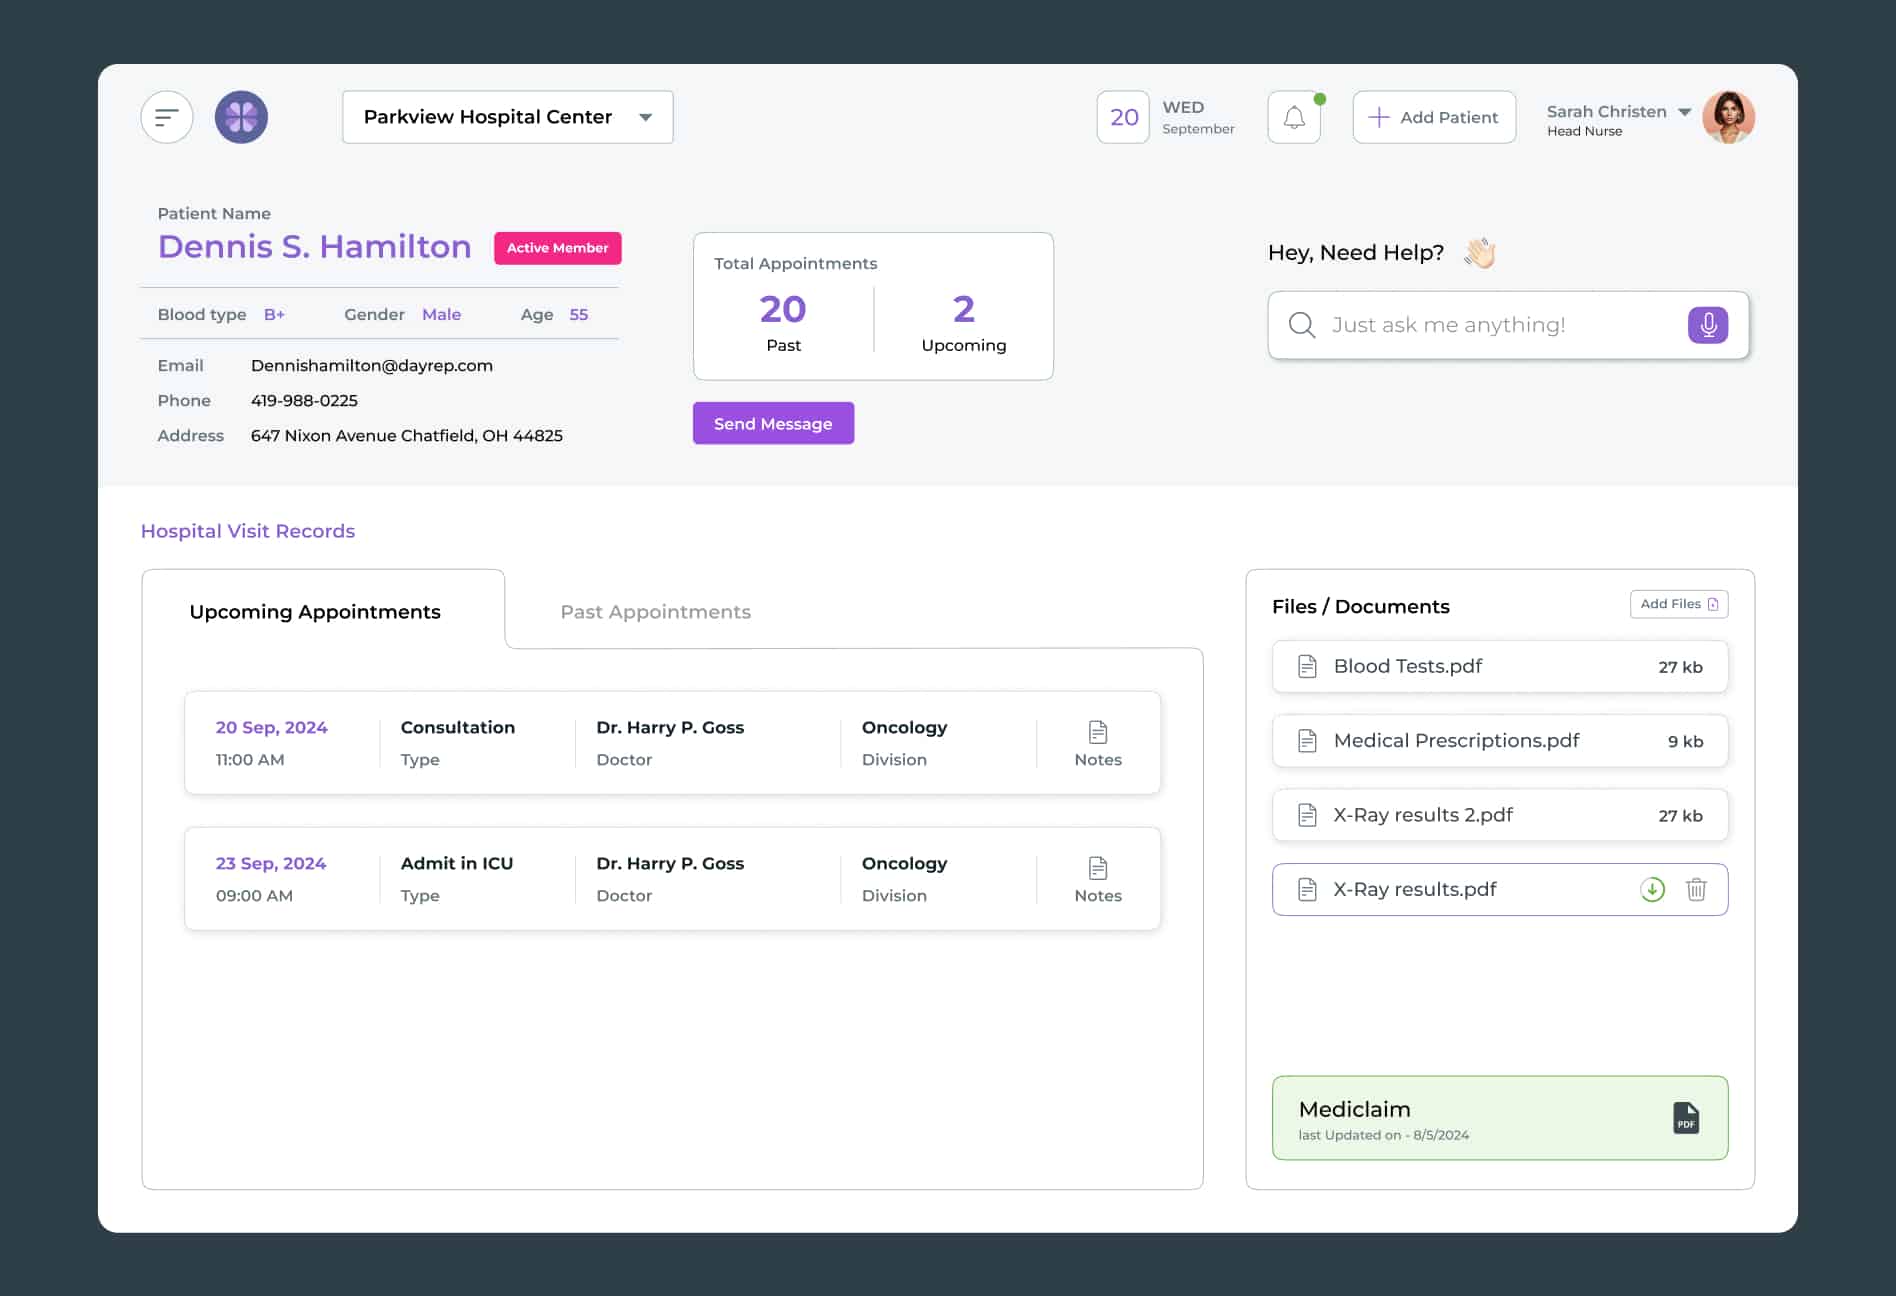
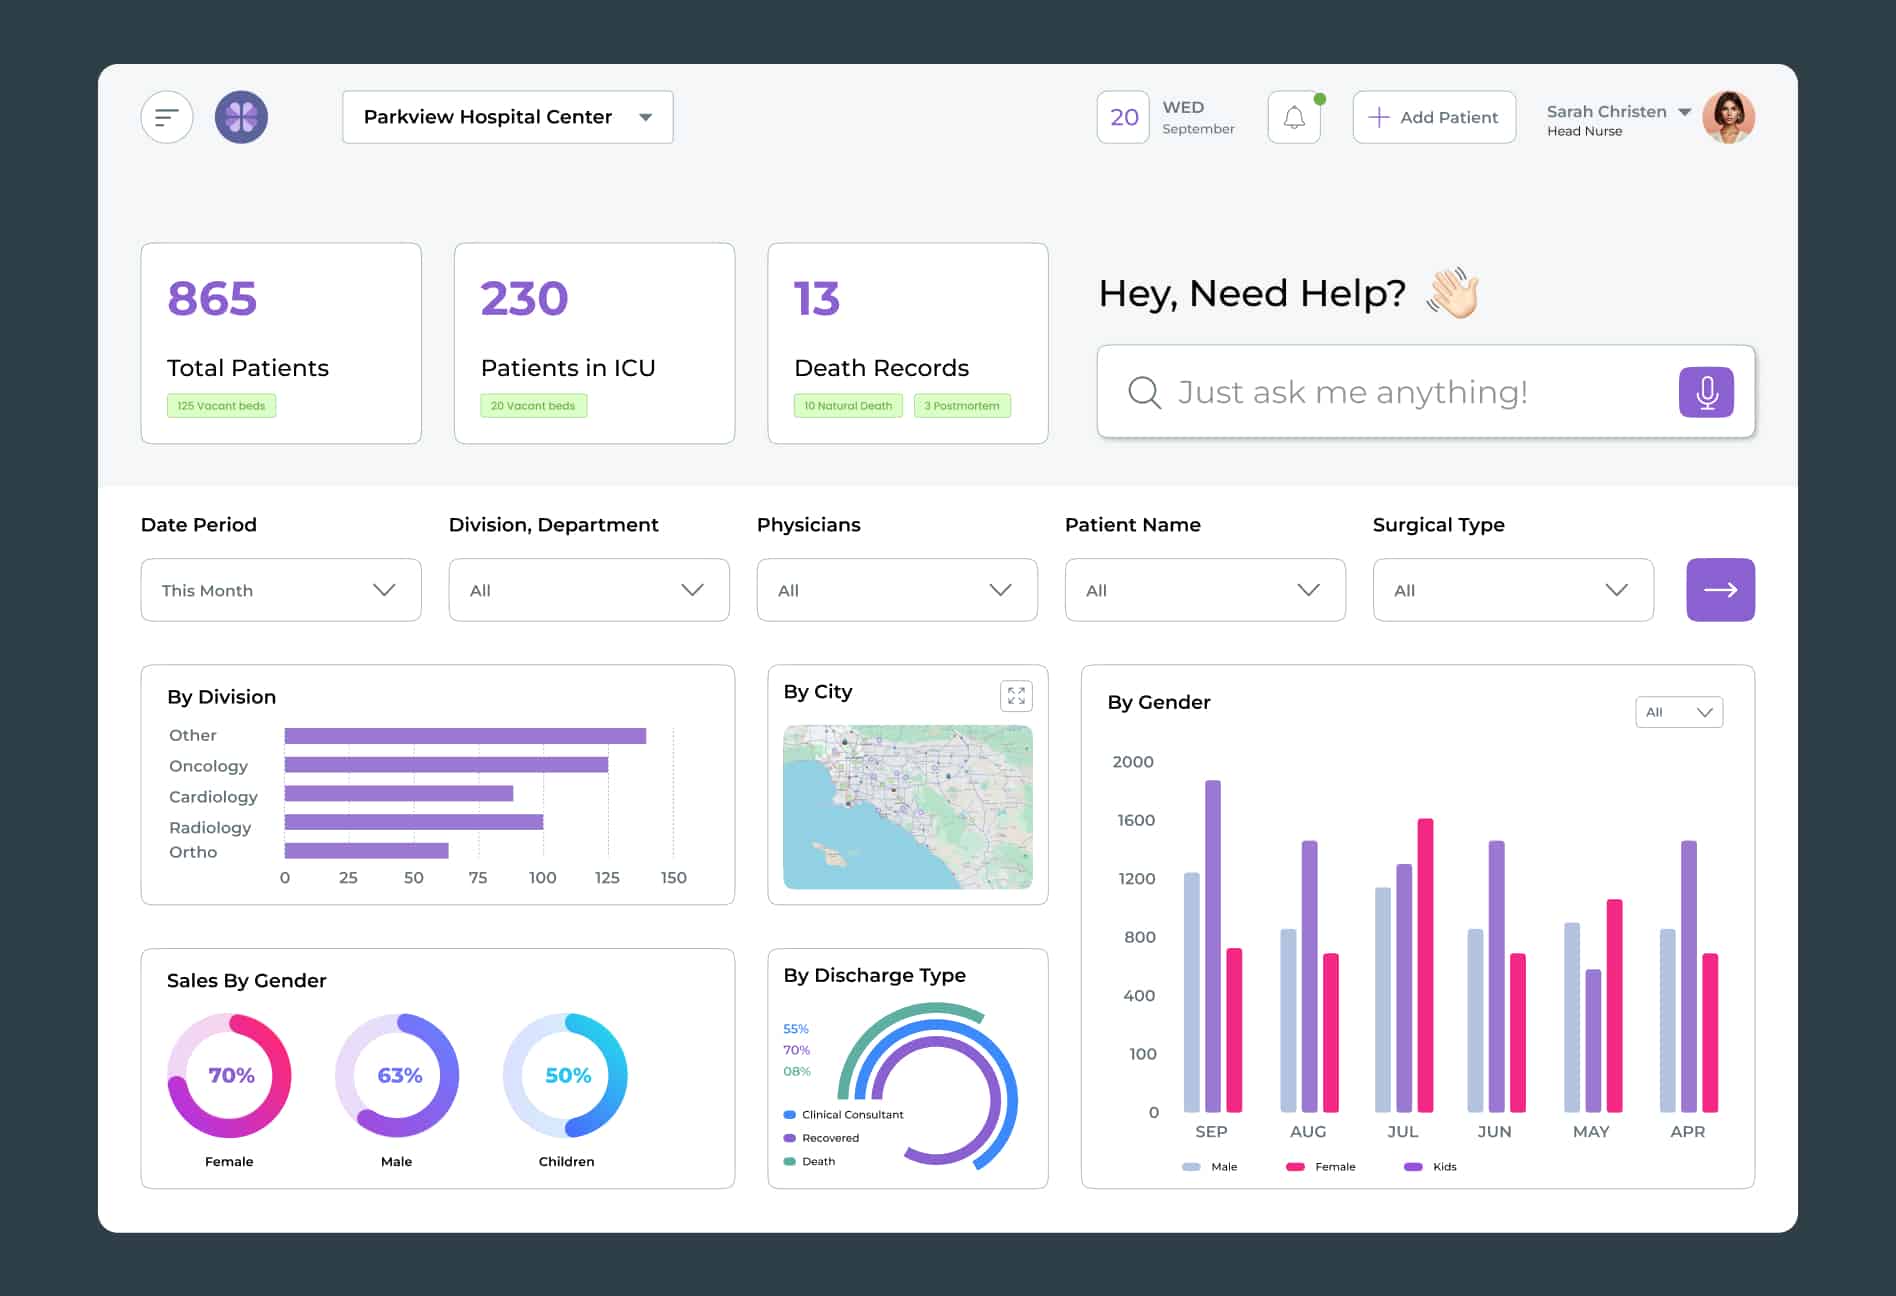
  • The primary business need was to create an innovative Patient Management Dashboard that will enable top hospital officials to monitor several spheres of patients’ treatment efficiently.
  • The client required the system that would be capable of presenting all information regarding the patient that would enable doctors to have better control over the overall operations.
  • They also want to assist their team to make right decisions by providing them accurate and relevant information.

Challenges Faced by Client

Limited Technical Experience

Limited Technical Experience

Lack of technical skills of the hospital management was a major disadvantage since the relevant information required for efficient planning and management of patients was trapped in the electronic system.

Manual Processes

Manual Processes

A significant amount of data had to be pre-processed, including extraction, cleaning, and curation, which took a lot of time and could be inaccurate.

Large Data Volumes

Large Data Volumes

The client required loading and analyzing patient data for the previous 10 years to obtain substantial information.

User Access Control

User Access Control

The client had multiple hospital centers for which he wanted to have good control on the users accessing his sites from those different sites.

  • Data Migration

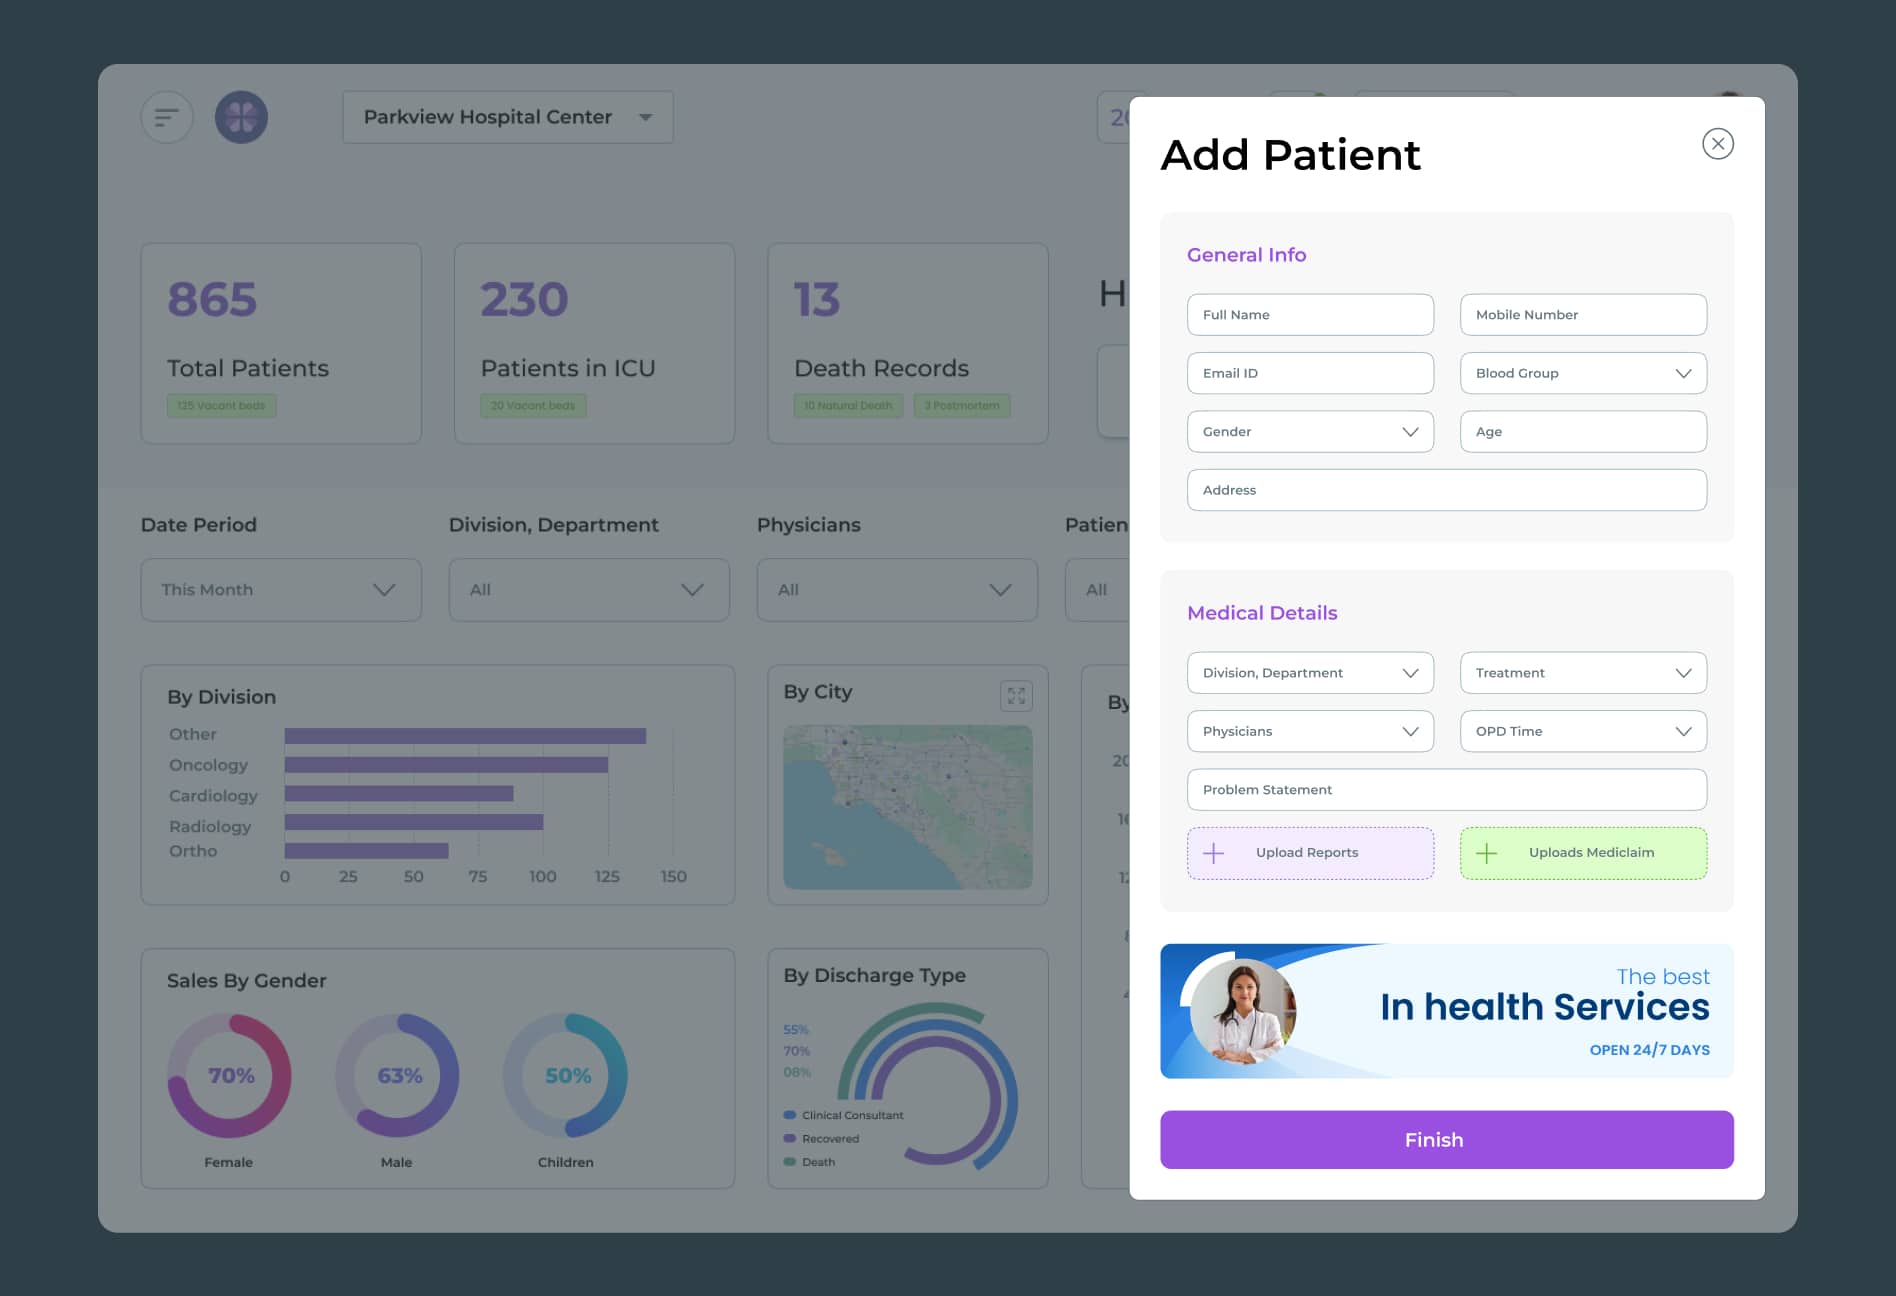
    We transferred data from the transaction system to a data warehouse through an SSIS package so as to provide all necessary data for the analysis.

  • Tabular Model

    We also used a tabular model in order to deal with high velocities of data, which are nearly real time data.

  • Custom Visualizations

    To improve qualitative analysis we incorporated innovation to the data interpretation by coming up with a modified lollipop chart.

  • Row-Level Security

    To implement access control at the field level, we have applied Power BI row-level security to hide some information from unauthorized users.
How We Tackled the Challenges

Project Glimpse

The global adoption rate of BI stands at 26%, indicating that a significant portion of businesses worldwide have recognized the value and importance of leveraging data for decision-making and performance improvement.

Features

Custom Visualizations
Patient Statistics Monitoring
Treatment Tracking
Treatment Tracking
SSIS Data Migration
SSIS Data Migration
Tabular Data Model
Tabular Data Model
Row-Level Security
Row-Level Security
Custom Lollipop Chart
Embedded Dashboard Code

Work Process

01
Research and Analysis

First, the peculiarities of the client’s needs, significant indicators, and the necessary data for patient control were determined.

Research-Analysis
02
Design

Then we specifically designed our interfaces to be clean, simple, and navigable while providing relevant and easy to locate patient information.

Design
03
Development

The development phase involved building the dashboard using Power BI and integrating it with SQL Server for data management.

Development
04
Testing

We conducted rigorous testing to ensure that the dashboard performed efficiently under heavy data loads and provided accurate real-time insights.

Testing Everything
05
Launch

After successful testing and client approval, the dashboard was deployed and embedded into the client’s web portal.

Launch

Result

  • 01.
    Enhanced Decision-Making

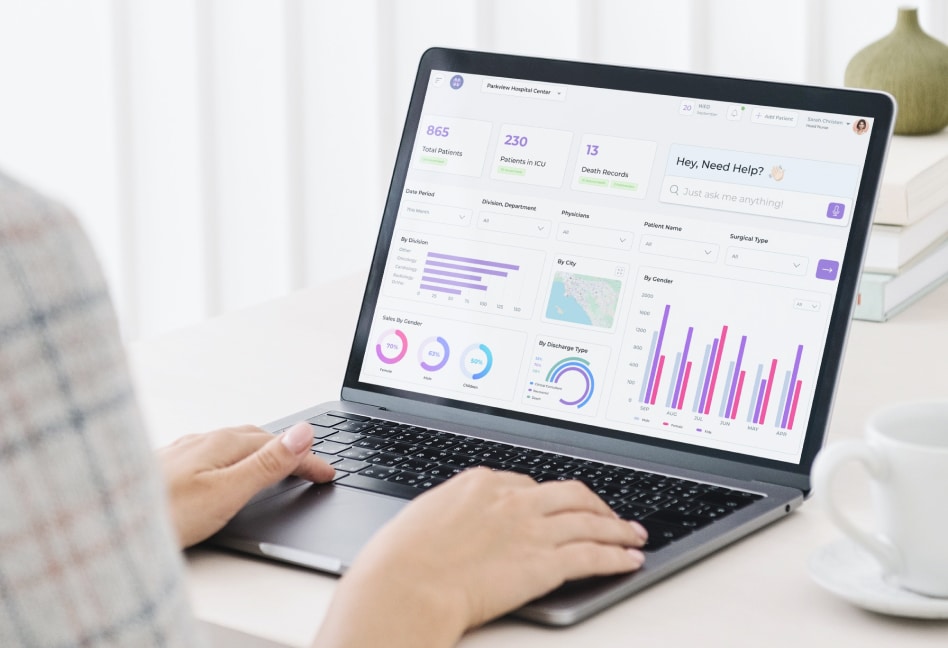
    The dashboard provided real-time insights, allowing the client to make informed decisions quickly.

  • 02.
    Efficient Data Management

    The integration of large data sets was streamlined, reducing manual processes and associated errors.

  • 03.
    Improved User Experience

    The user-friendly interface and secure access controls ensured that the dashboard was easy to use across all hospital centers.

  • 04.
    Optimized Performance

    Report load times were significantly reduced, and data storage was optimized, lowering the overall resource requirements.
Result for BI Analytics Patient Management

Let’s get in touch!