

Understanding Server Performance Metric with JMeter
Server performance is the backbone of any application’s stability, user satisfaction, and overall success. Without careful monitoring, systems can become sluggish or even crash under high traffic, leading to downtime and wasted resources.
That’s where JMeter steps in. This open-source software testing tool offers robust features for monitoring, analyzing, and improving server performance, making it easier to spot issues and maintain efficiency.
This blog will cover how JMeter streamlines the process of server performance monitoring and why staying on top of these metrics is crucial for keeping your systems running smoothly.
What is Performance Testing Metrics?
Performance testing metrics are the most critical factors used to determine the rate, speed, and stability of an application. There are other key performance testing metrics such as response time, this refers to the amount of time that the system takes in order to respond to the action of the user, the throughput which is the amount of data and/or transactions that can go through the system within a given time frame.
Latency looks at the time it takes to get the first byte after a request is made while concurrent users measures efficiency of a system in handling multiple users. The error rate demonstrates the number of failed requests based on the total number of sent requests, which reflects the ability of the system to remain stable under pressure and produce positives results under concurrent processing.
Furthermore, the CPU and memory logs which depict the utilization of resources are significant in determining the utilization of the application whereas the logs of network bandwidth and disk I/O depict the performance issues associated with data transfer and storage.
Scalability evaluates the performance variation with load while peak response time reflects the highest response time of the system in the actual test. Collectively, these software performance testing metrics enable the testing of the degree of efficiency and effectiveness of the application under assumed conditions.
Server Performance Monitoring in JMeter
Applications are hosted on servers, and when we test their performance, we also load the servers. It is essential to know the servers’ CPU, Memory, Disk I/O, and Network efficiency while measuring the application’s performance.
Usually, people are monitoring the client side metrics but if we gather the details of server side metrics then we will be able to see the complete picture about application performance and can find root cause easily if there is any bottleneck in the application, in the network or in the server configuration.
Although there are various APM(Application Performance Monitoring) tools available in the market that can monitor the server health, in this section we are going to discuss the Perfmon plugin available in the JMeter to monitor the server health.
Configure the Perfmon plugin.
To start monitoring the server health, we need to do the following two configurations:
- Setup Server Agent on the servers
- Install Plugin “PerfMon Metrics Collector” in JMeter
Server Agent
Download the PerfMon Server Agent from GitHub. Extract it and keep it on each Server where you would like to gather the metrics. No need to have a root or administrator access.
Go to the extractor folder and run startAgent.bat if you are in Windows or run startAgent.sh in macOS/Linux operating system
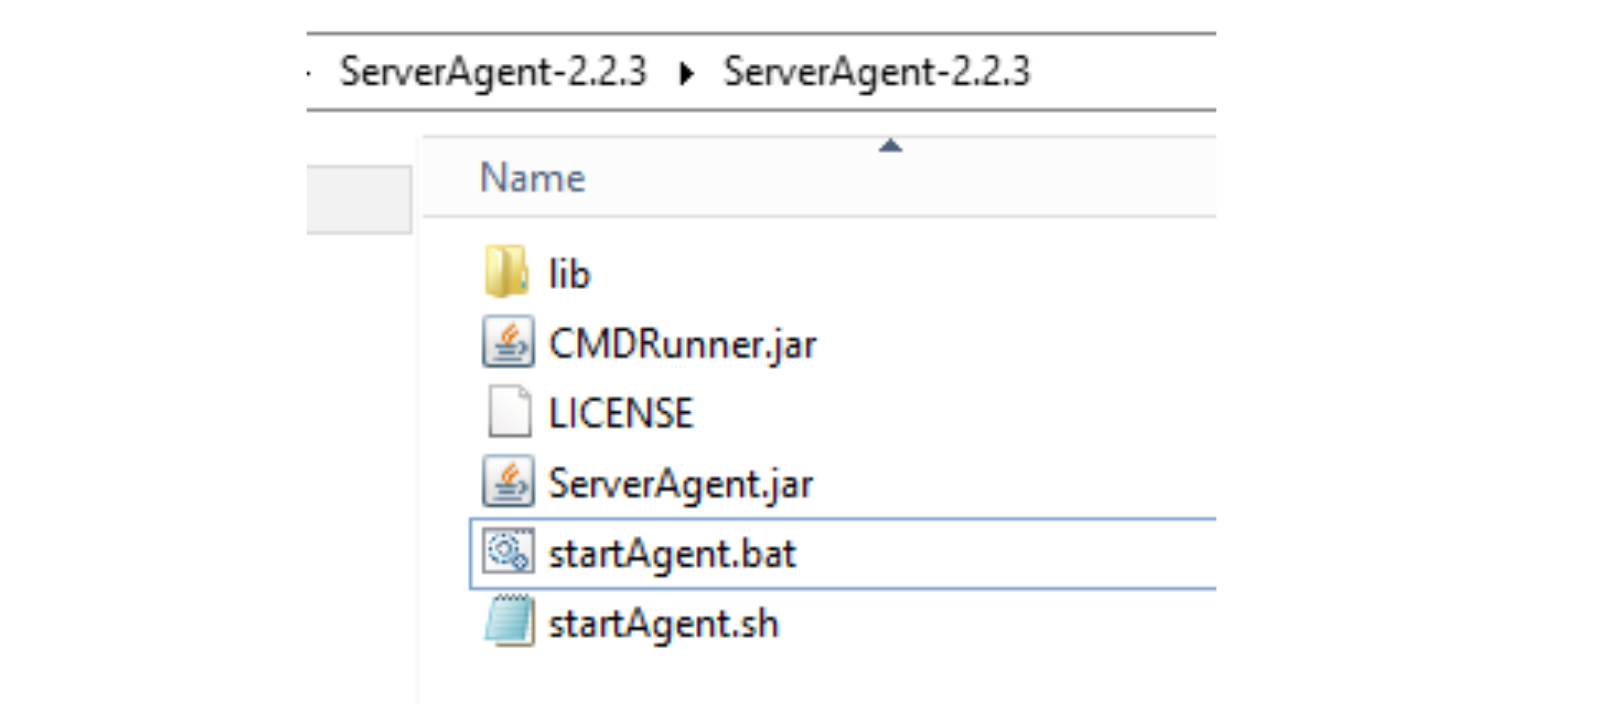
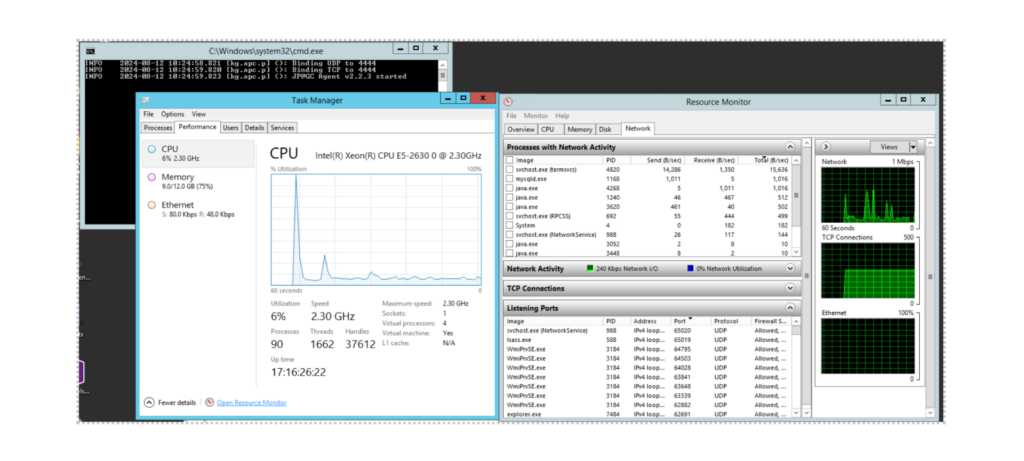
This will start the agent in the default port 4444 as shown below.
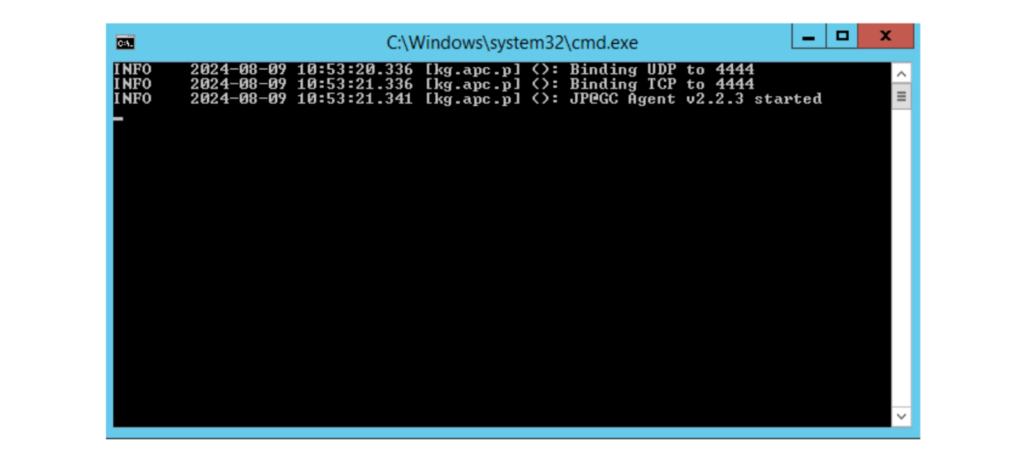
To change the port, you can use this command .\startAgent.bat –tcp-port 4445.
PerfMon Metrics Collector Plugin
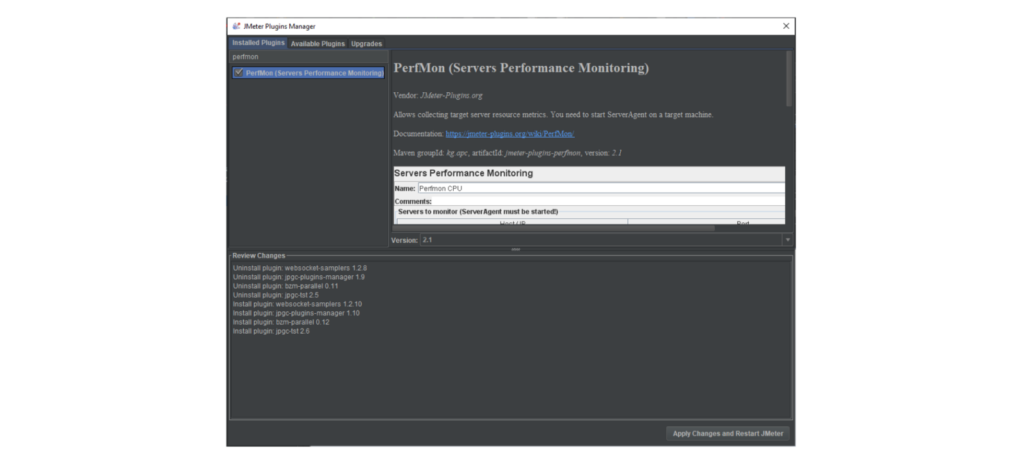
Please make sure that Plugins Manager is enabled on your JMeter. If not, please install the Plugins Manager first. Go to Plugins Manager, Search for “PerfMon” in the Available Plugins tab, and install it.
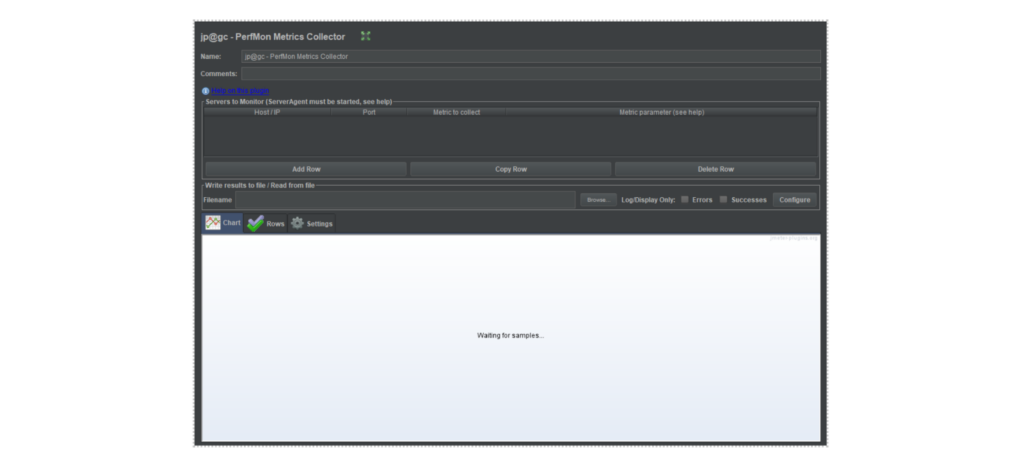
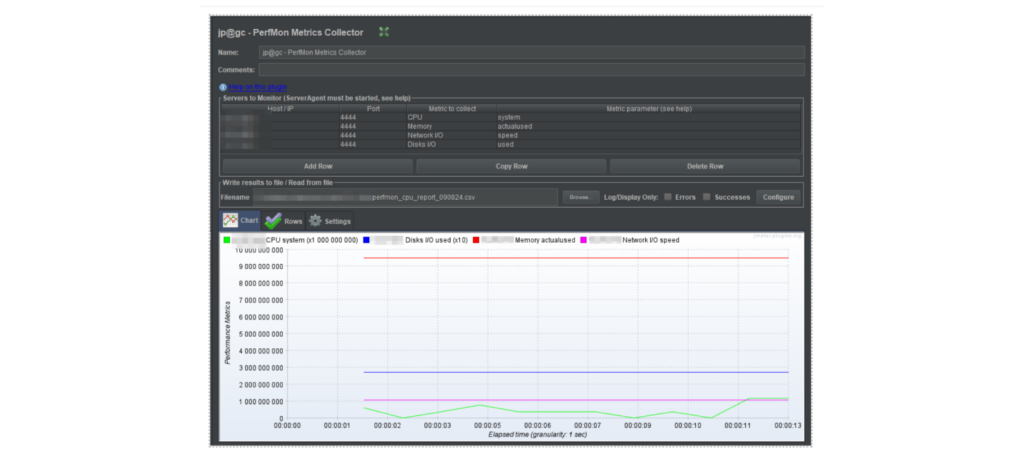
Once the plugin is installed, restart the JMeter and add the jp@gc – PerfMon Metrics Collector by right clicking on the Thread Group > Add > Listener > jp@gc – PerfMon Metrics Collector. This will add a listener to your test plan as shown below.
Configure the Plugin
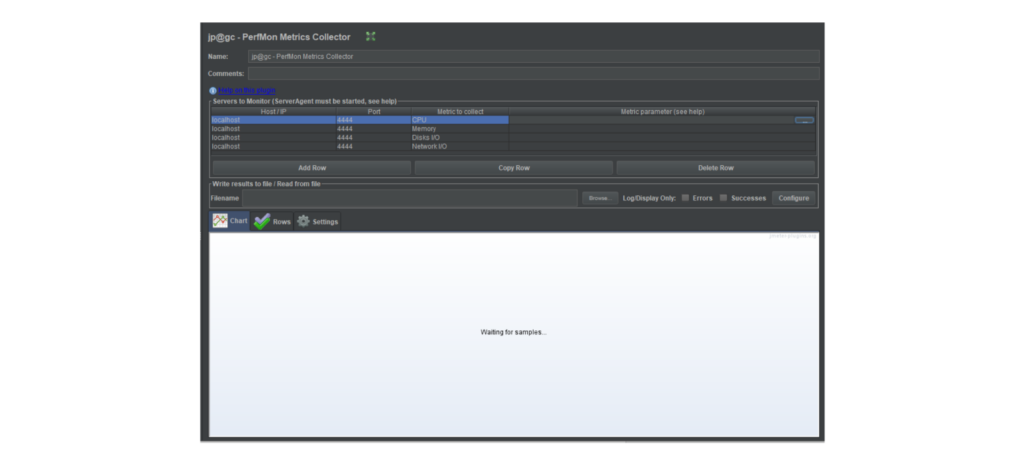
Users can configure the plugin by clicking on the Add Row button, and it will add a row with default values for Host/IP, Port, and Metric to Collect Metric Parameters.
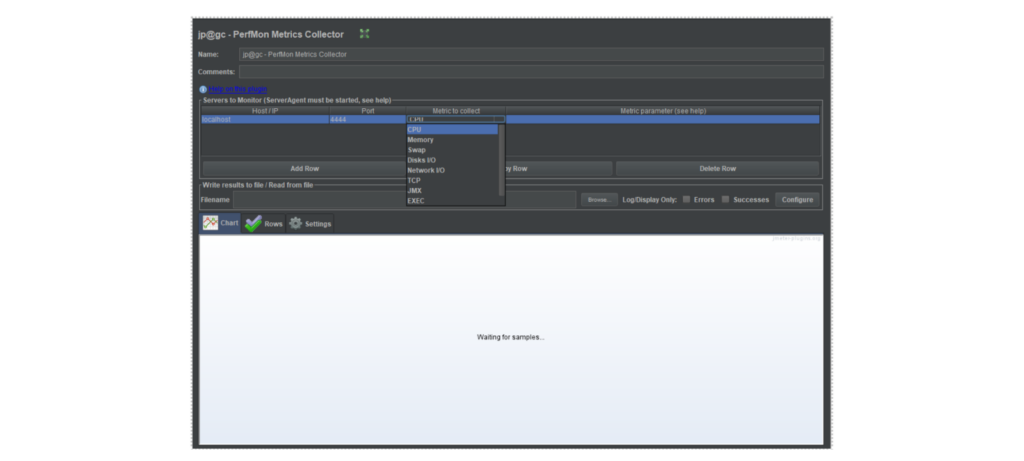
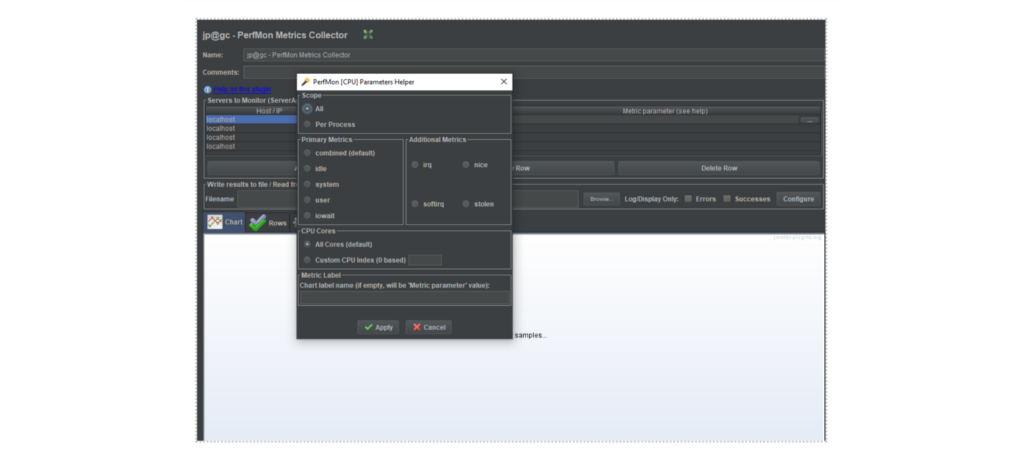
User can select Metrics like CPU, Memory, Disk I/O or Network I/O and can also add additional parameters for each metric type.
Start the Test:
Now run the script; after some time, it will start showing graphs for selected metrics and their parameters.
You can also check the task manager > Performance Tab for CPU, Memory or Network I/O on the Server. Also, you can check the same by starting Resource Monitor from Task Manager on the Server. If using Linux servers, then you can run the “top” command to check the CPU, Memory, Disk, & Network resource utilization of the Server. There are also some advanced commands available which you can use to get more granular details from the Linux servers.
Understanding the Server Side KPI
Server-side Key Performance Indicators (KPIs) are critical metrics that provide insight into the health and efficiency of your server infrastructure.
These KPIs help identify bottlenecks, optimize performance, and ensure a smooth user experience. Some important server-side KPIs include:
Response Time: Measures how long it takes for the server to respond to requests. We will discuss the response time testing monitor in a later section, so stay with us.
Throughput: Represents the amount of data processed over time, indicating server efficiency.
Error Rate: Tracks the percentage of requests that result in errors.
Uptime/Downtime: Measures server availability and the total time it remains operational. Apart from these below are few other cerucial factors that plays a importamnt role.
CPU Usage: CPU Usage is one of the crucial software performance testing metrics as it helps to understand the percentage of CPU capacity utilized while processing user requests against the provisioned CPU capacity of the Server.
This metric, in conjunction with memory usage, helps define resources for the production environment so that it doesn’t fail when the application is under heavy load or has a very high volume of transactions.
For e.g., Amazon Prime Sale. Software testing Tools like JMeter can easily monitor this metric, but here is the formula to calculate CPU usage manually:
{1 – (idle time/total time)} * 100
Memory Usage: Like CPU Usage, Memory Usage is also an important performance testing metric and it helps determine the amount of memory consumed while serving user requests against total allocated memory. Usually, production servers are provisioned with enough memory to handle a very high amount of requests.
Resources like CPU & Memory incur the cost. If they are under-provisioned, then your application will fail to cater to user requests or might even crash in some cases. If over-provisioned, then it will be of no use, and again, it will be overhead to operational cost.
It is of paramount importance to monitor these metrics during performance testing to gauge the right amount of Memory and CPU required in a production environment.The formula to calculate Memory Usage:
(Used Memory/Total Memory) * 100
Latency: It is one of the crucial factors in monitoring application performance. Latency is defined as the time from just before sending the request to just after receiving the first part of the response. If latency is less, then it will boost the application performance by reducing the key response time to the user’s request.
If latency is higher, that means either Serverthe is taking longer to process the request, or there is some issue in the network as response data is taking a longer time to reach the destination. This can be investigated further to identify the root cause and can be fixed.
More sophisticated network tools are available in the industry that can easily identify if there is a prominent issue of latency in the network or if it is happening due to the misconfiguration of servers.
Disk I/O: It includes read, write, or input/output operations (defined in KB/s) involving a physical disk. In simple words, it is the speed with which the data transfer takes place between the hard disk drive and RAM, or basically, it measures active disk I/O time.
If the Server is reading data from a file on a server disk, the processor needs to wait for the file to be read (the same goes for writing).
In any case, whether reading or writing, if there is a delay or latency, the application’s performance will be degraded, and the user experience will be poor. For better application performance, it is good if the Server takes less time to perform disk I/O operations.
Bandwidth: Refers to the maximum amount of data capacity that the Server can transfer in one second over the network.
What is Response Time Test Monitor?
A Response Time Test Monitor measures how long it takes for a system or server to respond to a request made by a user or another system. This metric is crucial in performance testing, as it reflects the speed and efficiency of an application, website, or server under varying loads.
In performance testing, the key response time is typically broken down into:
• Request sent time (from client to server),
• Processing time (server processes the request),
• Response received time (server’s response to the client).
Monitoring response time helps identify potential bottlenecks and ensures that the application meets user expectations for speed and efficiency, especially under heavy traffic conditions.
Server Performance Metric with JMeter: The Conclusion
While there are so many paid tools available in the market for performance testing, JMeter provides the easiest way to configure the plugin and monitor the health of the server hosting the application.
Using Server performance metrics one can easily check the health of the servers by monitoring the KPIs like CPU Usage, Memory Usage, Disk I/O, & Network I/O.
JMeter Plugin also allows the monitoring of extra parameters for more granular details of each metric. In a nutshell, Using the Server monitoring plugin in JMeter, one case easily checks the Server’s health and can also find out if there is any bottleneck in the Server.
SPEC INDIA is your trusted partner for AI-driven software solutions, with proven expertise in digital transformation and innovative technology services. We deliver secure, reliable, and high-quality IT solutions to clients worldwide. As an ISO/IEC 27001:2022 certified company, we follow the highest standards for data security and quality. Our team applies proven project management methods, flexible engagement models, and modern infrastructure to deliver outstanding results. With skilled professionals and years of experience, we turn ideas into impactful solutions that drive business growth.
Table of contents
Delivering Digital Outcomes To Accelerate Growth
Let’s TalkTable of contents
Delivering Digital Outcomes To Accelerate Growth
Let’s Talk


Let’s get in touch!
India
SPEC House, Parth Complex, Near Swastik Cross Roads, Navarangpura, Ahmedabad 380009, INDIA.
-
 +91-79-26404031, 32-33-34
 -
 [email protected]
