In today’s fast-moving and competitive world, customers will not use your application, software, or website if it takes a long time to perform any action or takes ages to load the page on the application.
That’s why performance testing is essential to business success and gaining customer confidence. Before making your web application live, you must check its performance metrics for bottlenecks or crashing issues.
Different types of performance testing are available, and it is possible to club one or more types of performance testing to ensure that the application runs smoothly under varying user loads or traffic.
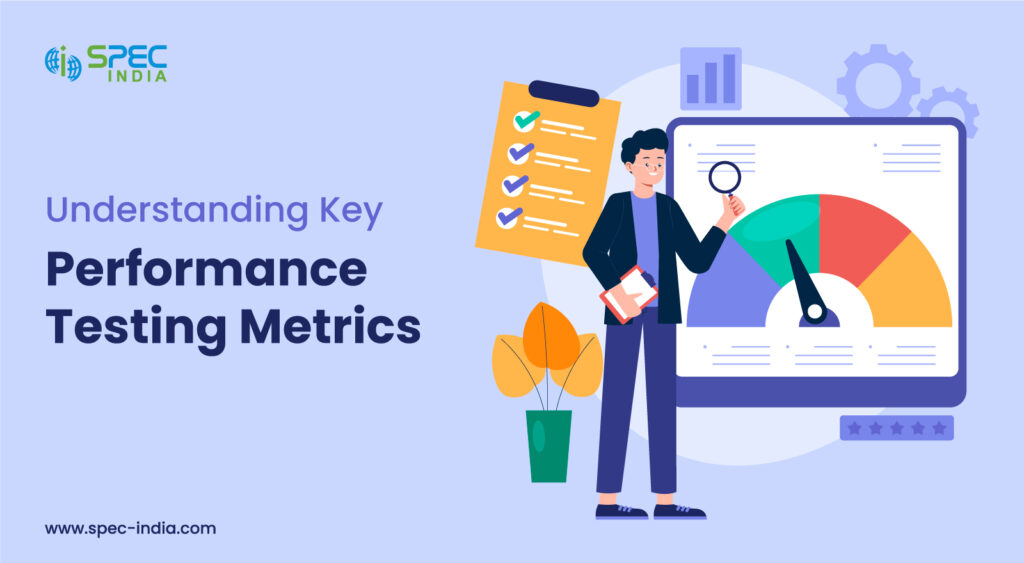
While we agree and understand the importance of performance testing, we should also understand some important performance testing metrics or Key Performance Indicators (KPIs) that can help us gauge the application’s performance.
Performance testing metrics provide statistical data gathered from the application’s test run. Performance Engineers analyze these metrics data and cross-check them against industry-standard values.
Then, they conclude whether there is any bottleneck in the system or if any improvement is required in the Server configuration, network configuration, or application code. They also ensure that extra resources are needed for the Server or database.
In short, performance testing metrics indicate the performance of your application, software, or website.
In the next section, we will cover some of the critical metrics that will enable you to judge the performance of your application. These metrics will help you identify any bottleneck in the application or software that needs to be fixed if the metric value is not within the acceptable range.
These test metrics in software testing can be measured on both the client and server sides. Some of the essential metrics that we are going to cover are –
Let’s discuss some crucial performance testing metrics that must be considered while testing the software.
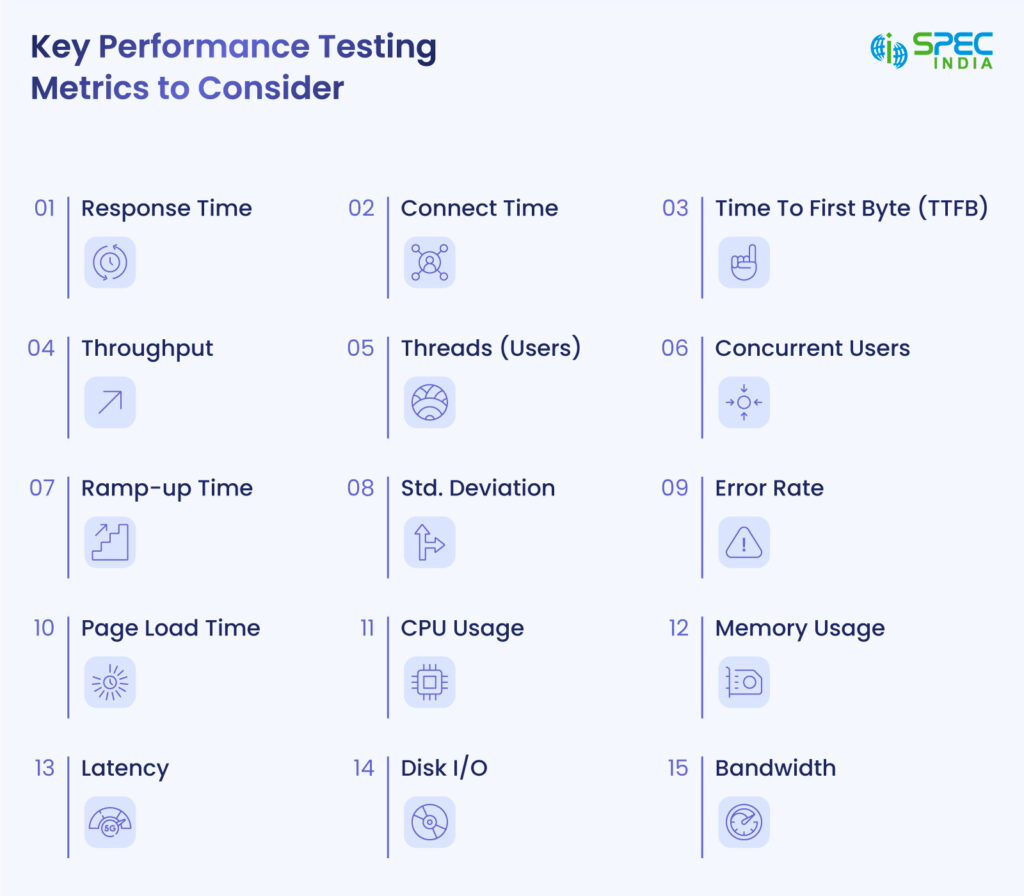
1. Response Time: It is defined as the time the Server takes to respond to the User’s request. It is essential to monitor the minimum, maximum, and average response time for any request made to the Server. Also, there is the 90th percentile, 95th percentile, and 99th percentile.
Apart from this, a response time test monitor is software that tracks the delay between a user request and the corresponding action taken by the system. Such monitoring is helpful if the goal is to achieve the highest level of effectiveness and optimal user convenience.
2. Connect Time: Connect time is the time it takes to connect between the TCP layer in the TCP/IP model client and Server using TCP Handshake.
3. Time to First Byte (TTFB): This is one of the critical response time metrics that needs to be considered. The TTFB, or Time-To-First Byte, is the total time to complete one HTTP request and load the first byte of the page.
4. Throughput: When it comes to application performance testing, it is also efficient to understand the system’s throughput. Hence, the number of requests the application processes within a one-time unit is calculated throughout.
For instance, if a server receives 60 requests in one minute, then throughput is one request per second. It is also measured in terms of Response per Second or Transaction per Second, abbreviated as RPS or TPS.
5. Threads (Users): The number of Threads is typically considered the number of virtual users who will send requests to the Server while conducting a performance test of an application or software. Here, software performance testing metrics play a crucial role.
Each thread will act as a user and send all the requests identified for running a performance test.
6. Concurrent Users: Several users are engaged with the site at a given time. They will be active and perform different actions on the system by sending requests parallel to it. If the system can cater to the requests of concurrent users within a defined vital response time, then it can handle that many simultaneous users.
But if it cannot handle or takes longer to serve the requests, then there is a chance that it is a performance bottleneck. This needs to be investigated further to identify the cause of the bottleneck and the need to fix it.
7. Ramp-up Time: It is the time it takes several users to be active and send requests. Ramp-up time is significant when planning to load or stress test applications with extremely high loads. It is also essential to give a realistic ramp-up time to imitate the real-life business scenario.
The formula for Ramp-up Time is (number of Users)/ Time Unit. For example, if there are 100 users and the ramp-up time is 10 seconds, ten users will become active every 1 second and send requests. So, the Ramp-up Rate is 10 Users per second.
8. Std. Deviation: It can usually be monitored using software testing tools like JMeter. It defines how much response time varies from its average. It alone cannot be used to judge a system’s performance, but it can tell if there is any fluctuation in the system response time. As per industry standard, the deviation should be less than 5% of the average response time.
9. Error Rate: It is measured as the number of requests that fail against the total number of requests sent. This metric helps us determine if there is a bottleneck in the system while conducting the performance test.
However, we need to find out the reasons for the errors, as this might also happen if the system being used to send traffic is not provisioned with enough resources like CPU, RAM, or Bandwidth. Also, the error might occur if the user traffic or load is exceptionally high and not enough ramp-up time is given.
10. Page Load Time: This is the time the browser requires to download all the website’s contents and display them within the browser window. This is a client-side metric, and it will determine the time the browser takes to build the entire page and present it to the User by loading HTML, JS, CSS, and AJAX components to the User’s browser.
It was necessary to increase this value as it directly influences the User’s interaction with the application. The smaller the value of page load time, the higher the application’s performance and the users’ satisfaction level.
This is one of the essential test metrics in software testing. Regarding load times, the critical response time is less than three sections.
Load Time: < 3 seconds
11. CPU Usage: CPU Usage is an essential metric in performance testing as it helps to understand the percentage of CPU capacity utilized while processing user requests compared to the Server’s provisioned CPU capacity.
This metric, in conjunction with Memory usage, helps define resources for the production environment so that it doesn’t fail when the application is under heavy load or a very high volume of transactions is happening on the application.
For e.g., Amazon Prime Sale. Tools like JMeter can easily monitor this metric, but here is the formula to calculate CPU usage manually:
{1 – (idle time/total time)} * 100
12. Memory Usage: Like CPU Usage, Memory Usage is also a critical performance testing metric. It helps determine the amount of memory consumed while serving user requests against the total allocated memory.
Usually, production servers are provisioned with enough memory to handle a very high number of requests. Resources like CPU & Memory incur the cost. If they are under-provisioned, your application will fail to cater to user requests or might even crash.
If over-provisioned, it will be useless; again, it will be overhead to operational costs. Monitoring these metrics during performance testing is paramount to gauge the right amount of Memory and CPU required in a production environment. The formula to calculate Memory Usage:
(Used Memory/Total Memory) * 100
13. Latency: It is one of the crucial factors in monitoring application performance. Latency is the time from just before sending the request to just after receiving the first part of the response. If latency is less, it will boost the application’s performance by reducing the response time to the User’s request.
If latency is higher, either the Server is taking longer to process the request, or there is some issue in the network as response data is taking longer to reach the destination. This can be investigated further to identify the root cause and can be fixed.
More sophisticated network tools are available in the industry that can quickly identify a prominent latency issue or determine if it has happened due to a server misconfiguration.
14. Disk I/O: Disk I/O includes read, write, or input/output operations (defined in KB/s) involving a physical disk. Simply put, it is the speed with which the data transfer occurs between the hard disk drive and RAM, or it measures active disk I/O time. If the Server reads data from a file on a server disk, the processor must wait for the file to be read (the same goes for writing).
In any case, whether reading or writing, if there is a delay or latency, it will lead to degraded application performance and poor user experience. For better application performance, it is good if the Server takes less time to perform disk I/O operations.
15. Bandwidth: Refers to the maximum amount of data capacity that the Server can transfer in one second over the network.
Performance Testing Metrics are critical in assessing the performance of applications, software, or websites. They give insight into your application’s reliability, stability, and scalability. Using these web application performance metrics, the organization can identify any performance bottlenecks in the application or improvement areas that need to be addressed.
Using these software performance testing metrics, teams can optimize the software’s performance and ensure that application end users get the best user experience.
Ready to Optimize Your Software’s Performance?
At Spec India, we have the capabilities to deliver the best software development services you require. Our dedicated team of experienced developers uses the most effective performance testing tools and adheres to software best practices to guarantee the reliability and efficiency of your applications.
Get in touch with us today and learn how we can improve the performance of your software.
SPEC INDIA is your trusted partner for AI-driven software solutions, with proven expertise in digital transformation and innovative technology services. We deliver secure, reliable, and high-quality IT solutions to clients worldwide. As an ISO/IEC 27001:2022 certified company, we follow the highest standards for data security and quality. Our team applies proven project management methods, flexible engagement models, and modern infrastructure to deliver outstanding results. With skilled professionals and years of experience, we turn ideas into impactful solutions that drive business growth.
SPEC House, Parth Complex, Near Swastik Cross Roads, Navarangpura, Ahmedabad 380009, INDIA.

This website uses cookies to ensure you get the best experience on our website. Read Spec India’s Privacy Policy